Tour

Every screen, in light and dark.

Each image below is a real capture of Chronicle running locally against fictional data for StrataForge Robotics, a made-up company. Switch the site theme and the screenshots follow.

Illustration: an aerial view of a braided river delta, many thin channels branching and converging.

Overview

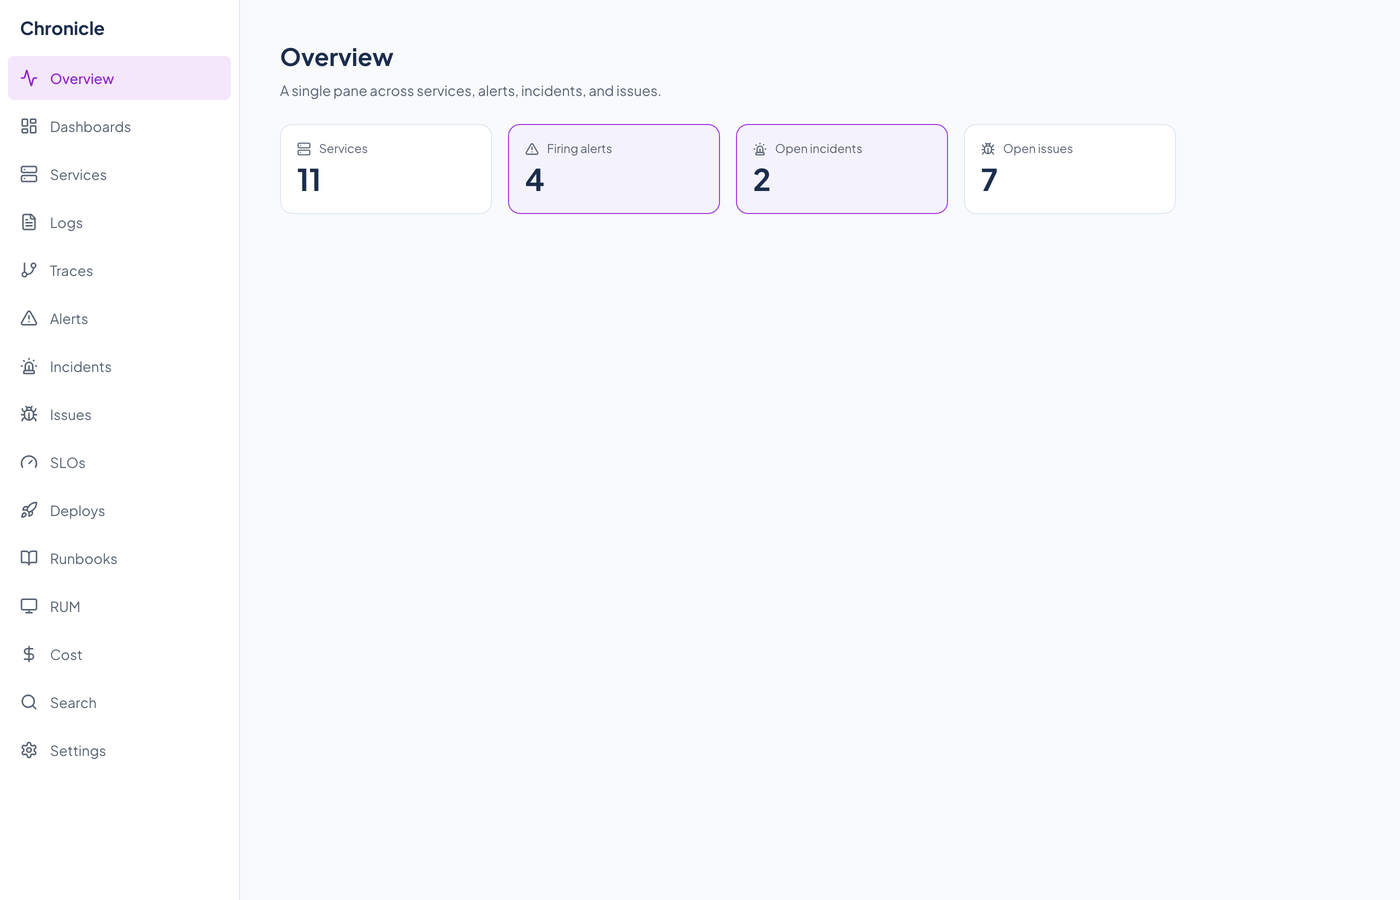
Chronicle's Overview page with four stat cards.Chronicle's Overview page with four stat cards.
Four counts for the whole workspace: services, firing alerts, open incidents, and open issues. Anything firing or open is outlined in the accent color. Enlarge to see the full screen.

Services

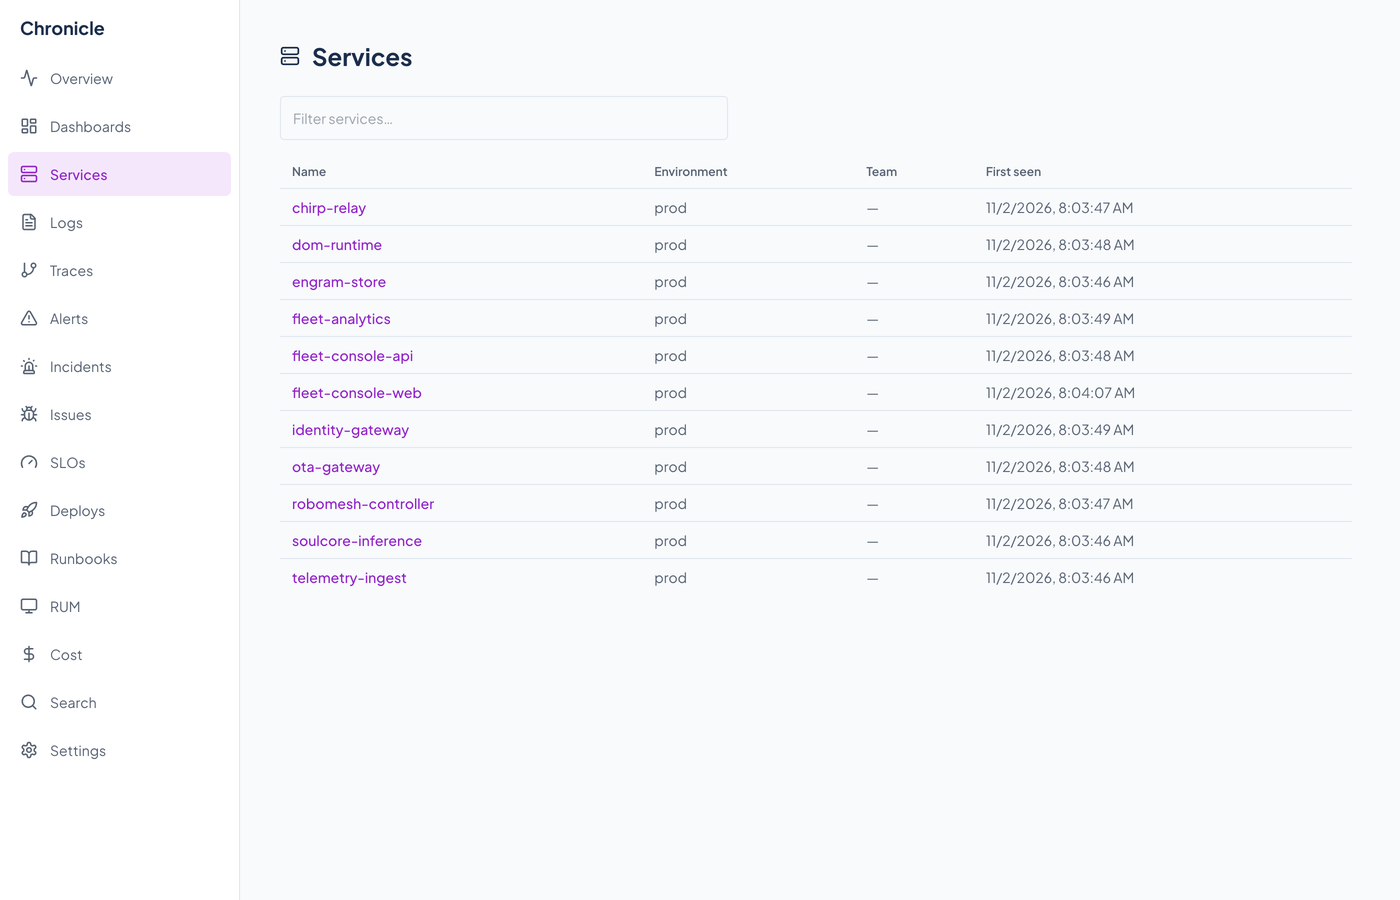
Chronicle's Services catalog with one row per reporting service.Chronicle's Services catalog with one row per reporting service.
Every service that has sent a metric, log, or trace, filled in from the telemetry itself.

One service

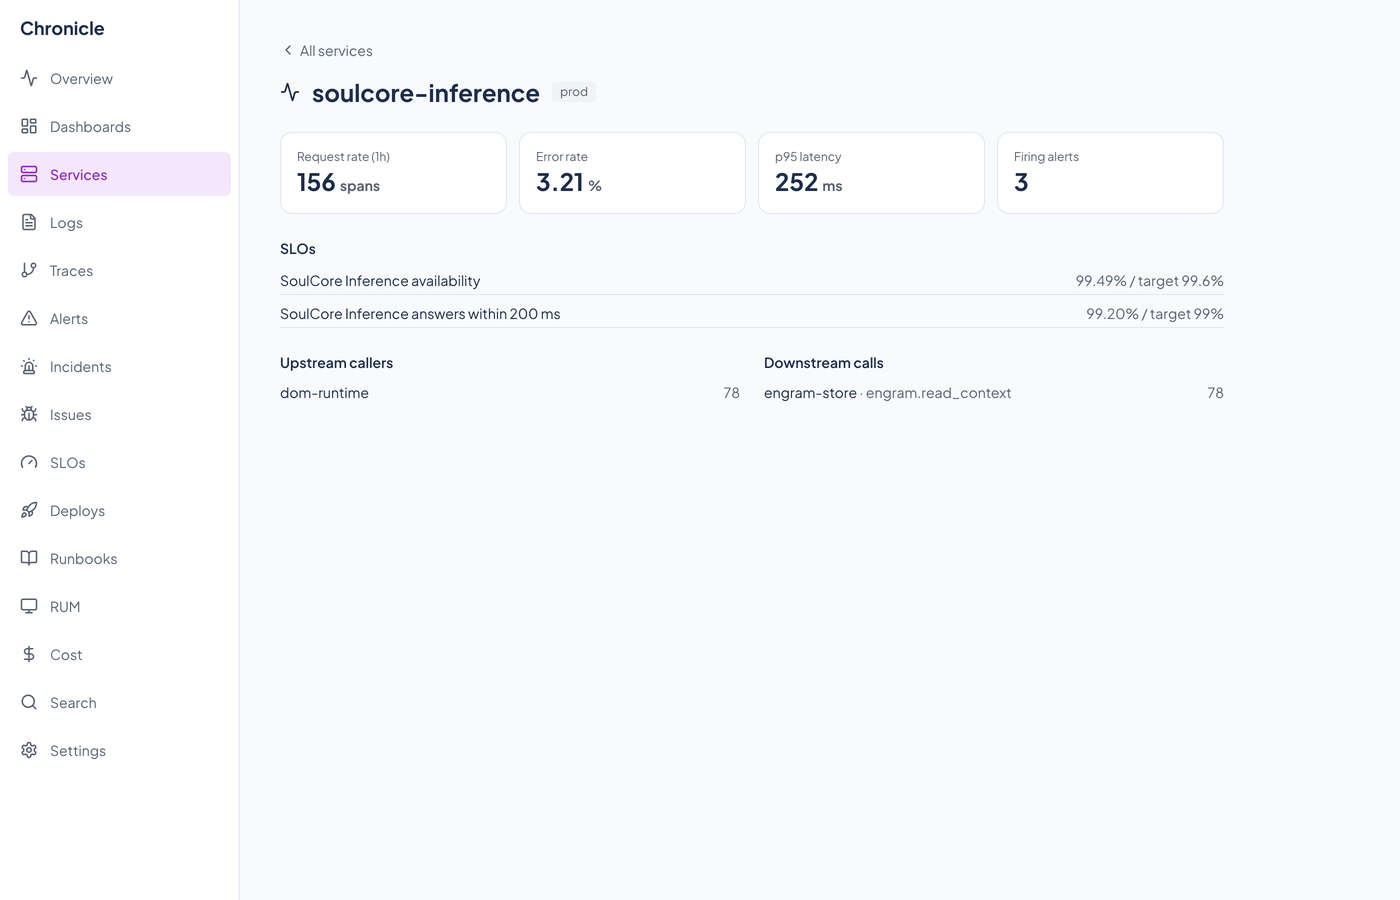
Chronicle's detail page for one service with its SLOs and dependencies.Chronicle's detail page for one service with its SLOs and dependencies.
A service's SLOs, the callers found upstream in its traces, and the calls it makes downstream.

Logs

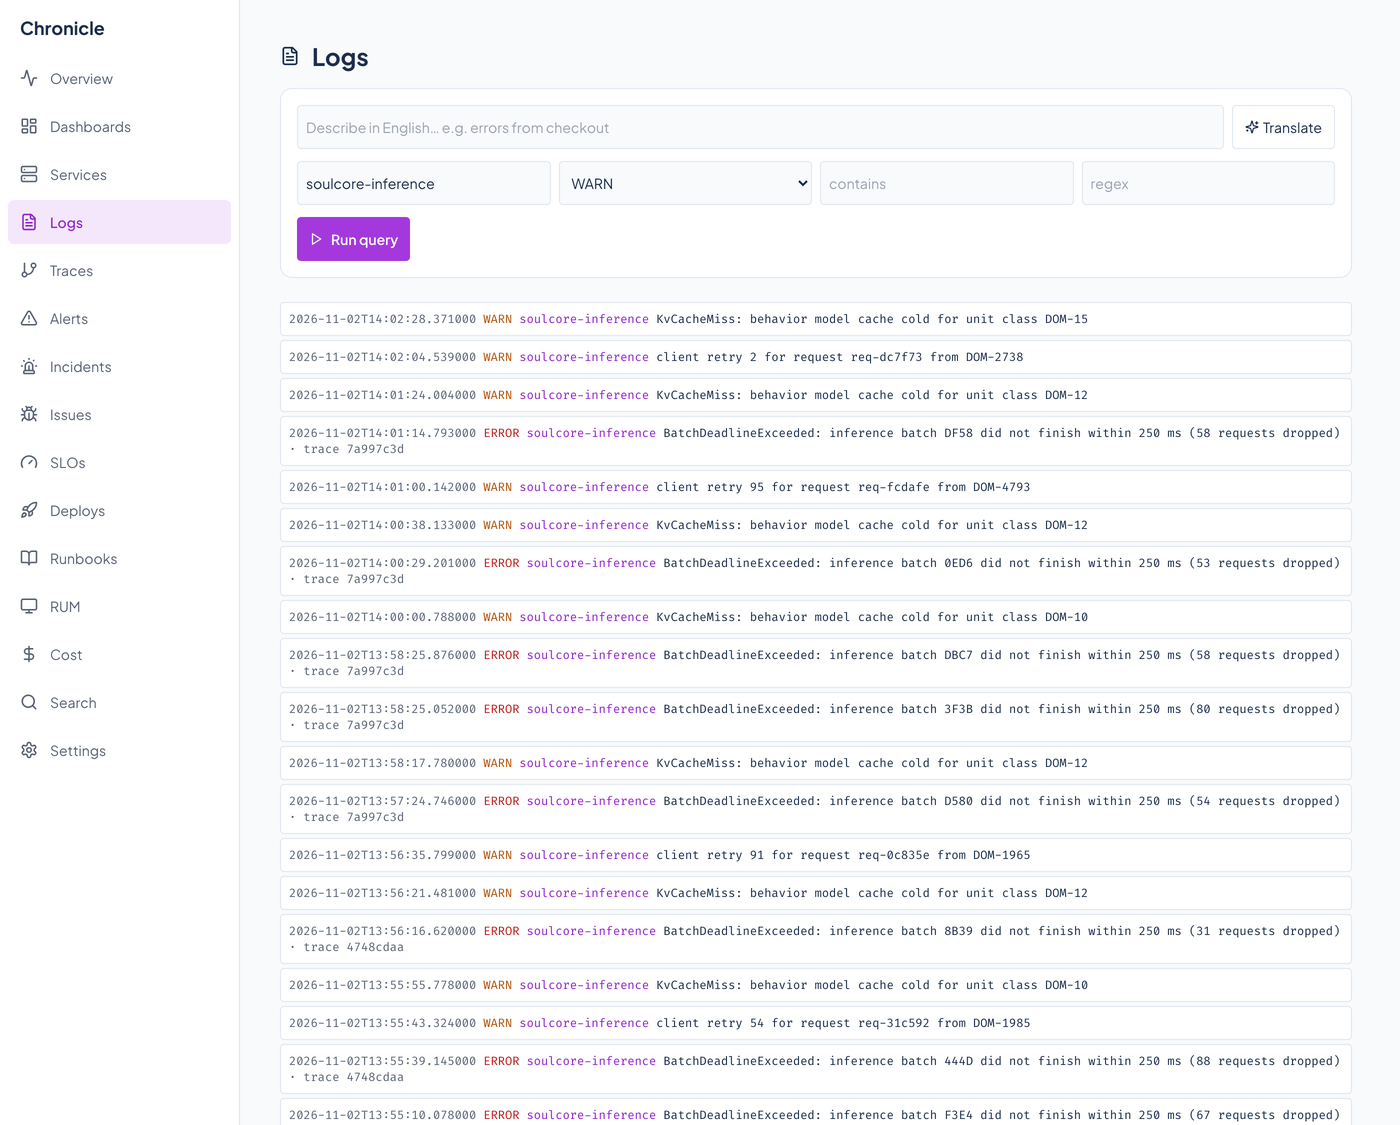
Chronicle's Logs explorer with severity-colored log lines.Chronicle's Logs explorer with severity-colored log lines.
Search log lines by severity, service, and text. A line that carries a trace id shows it.

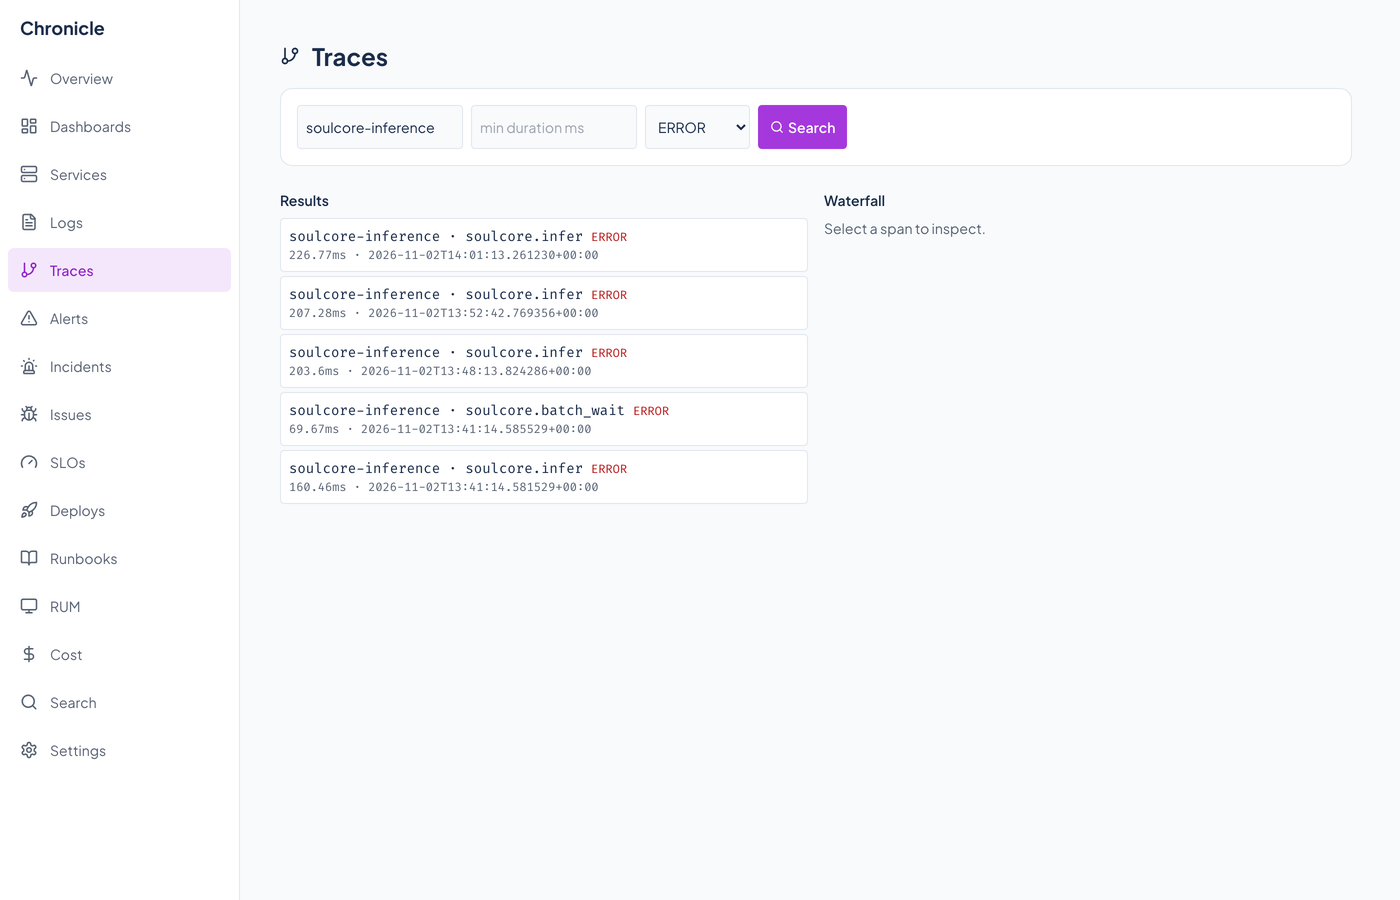
Traces

Chronicle's Traces page listing traces.Chronicle's Traces page listing traces.
Find a trace by its root operation, service, or duration.

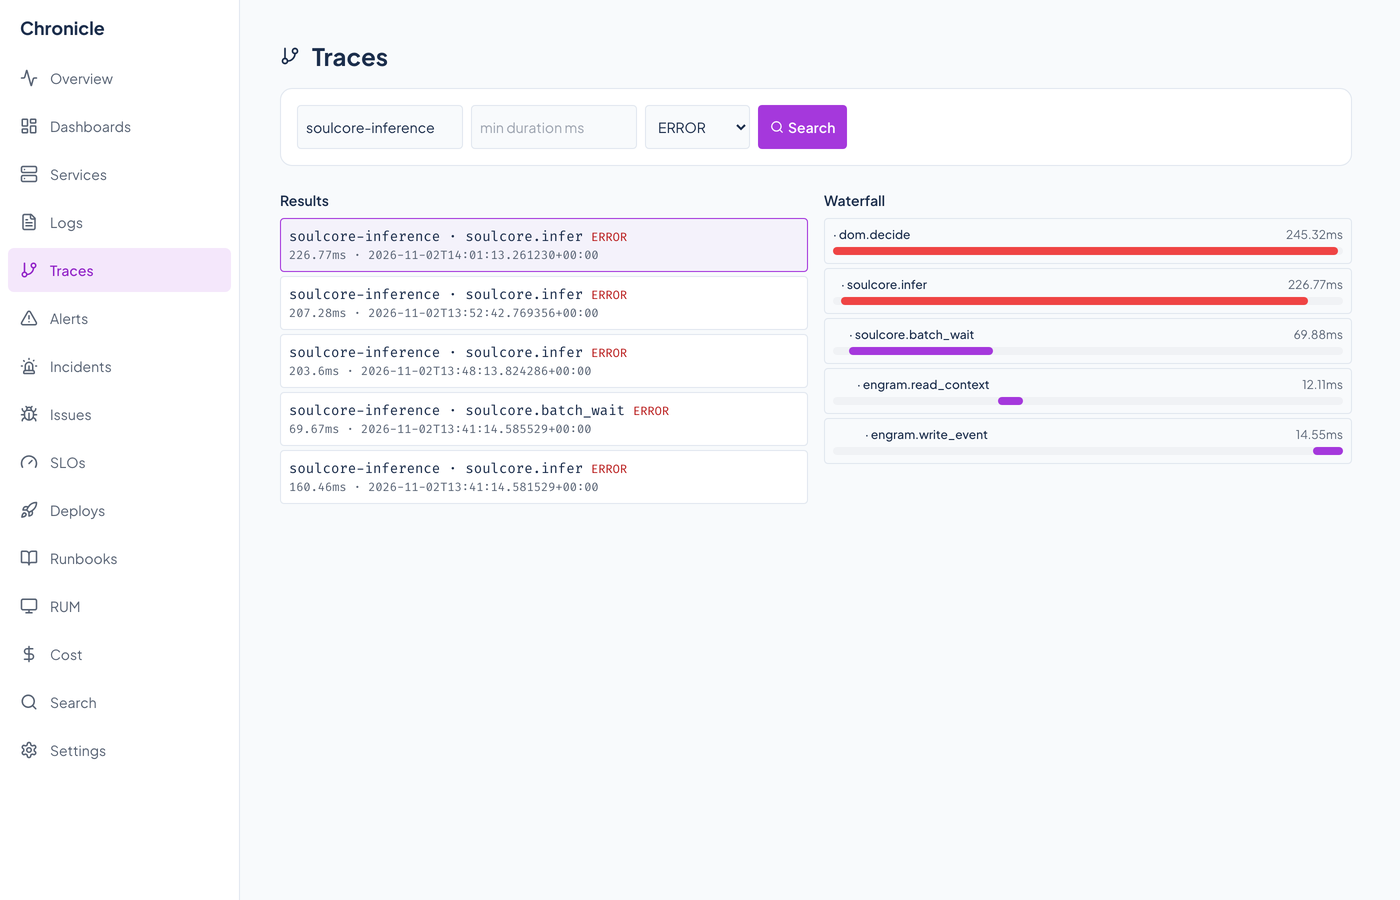
A trace, as a waterfall

Chronicle's trace waterfall with spans as horizontal bars.Chronicle's trace waterfall with spans as horizontal bars.
One request laid out span by span, each nested under its parent and sized by duration.

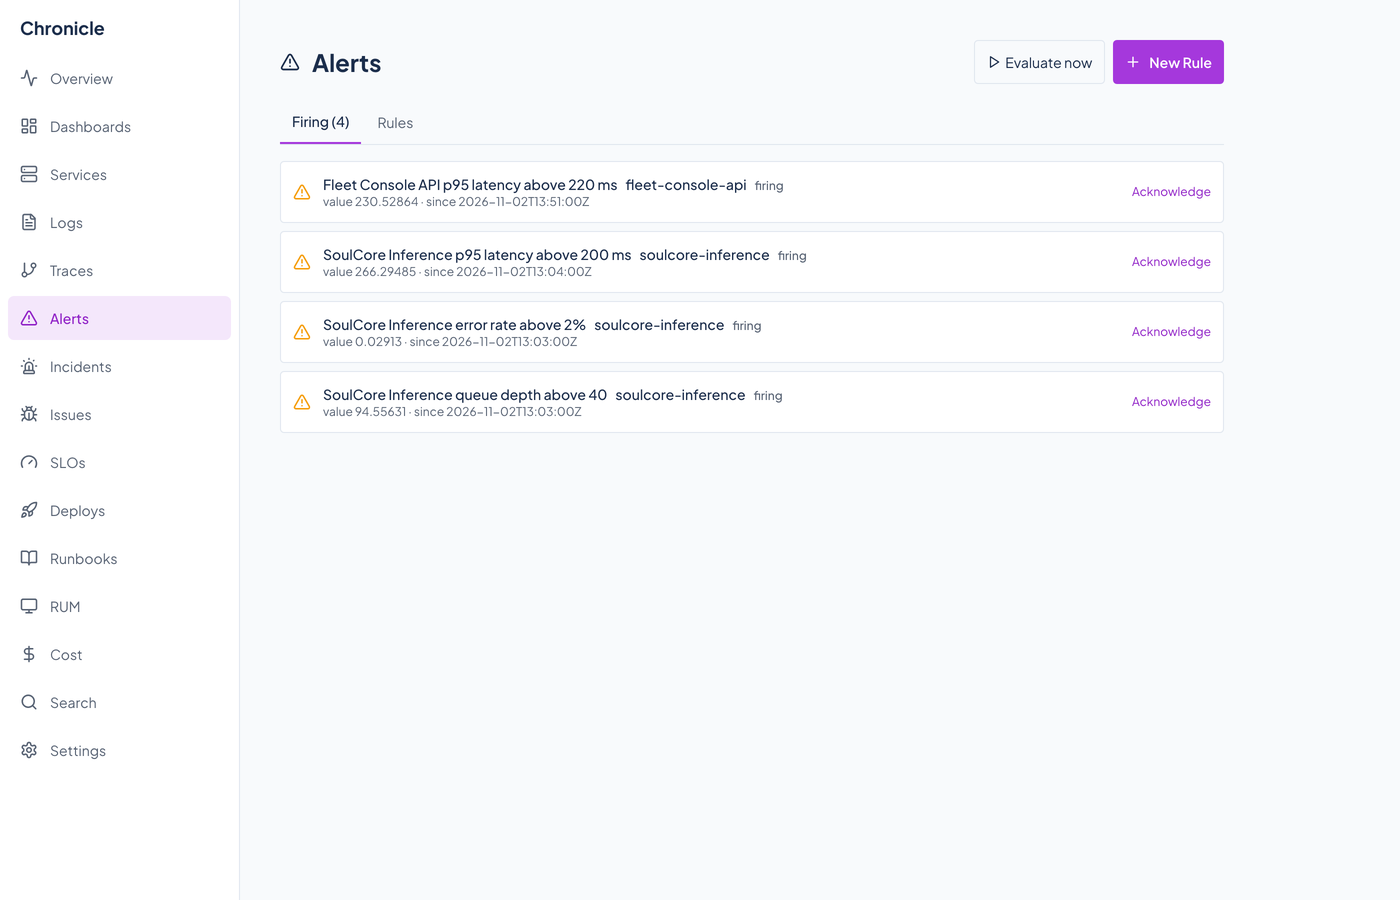
Alerts

Chronicle's Alerts page with firing alerts.Chronicle's Alerts page with firing alerts.
Firing alerts with their rule, service, current value, and when each started firing. Acknowledge one from here.

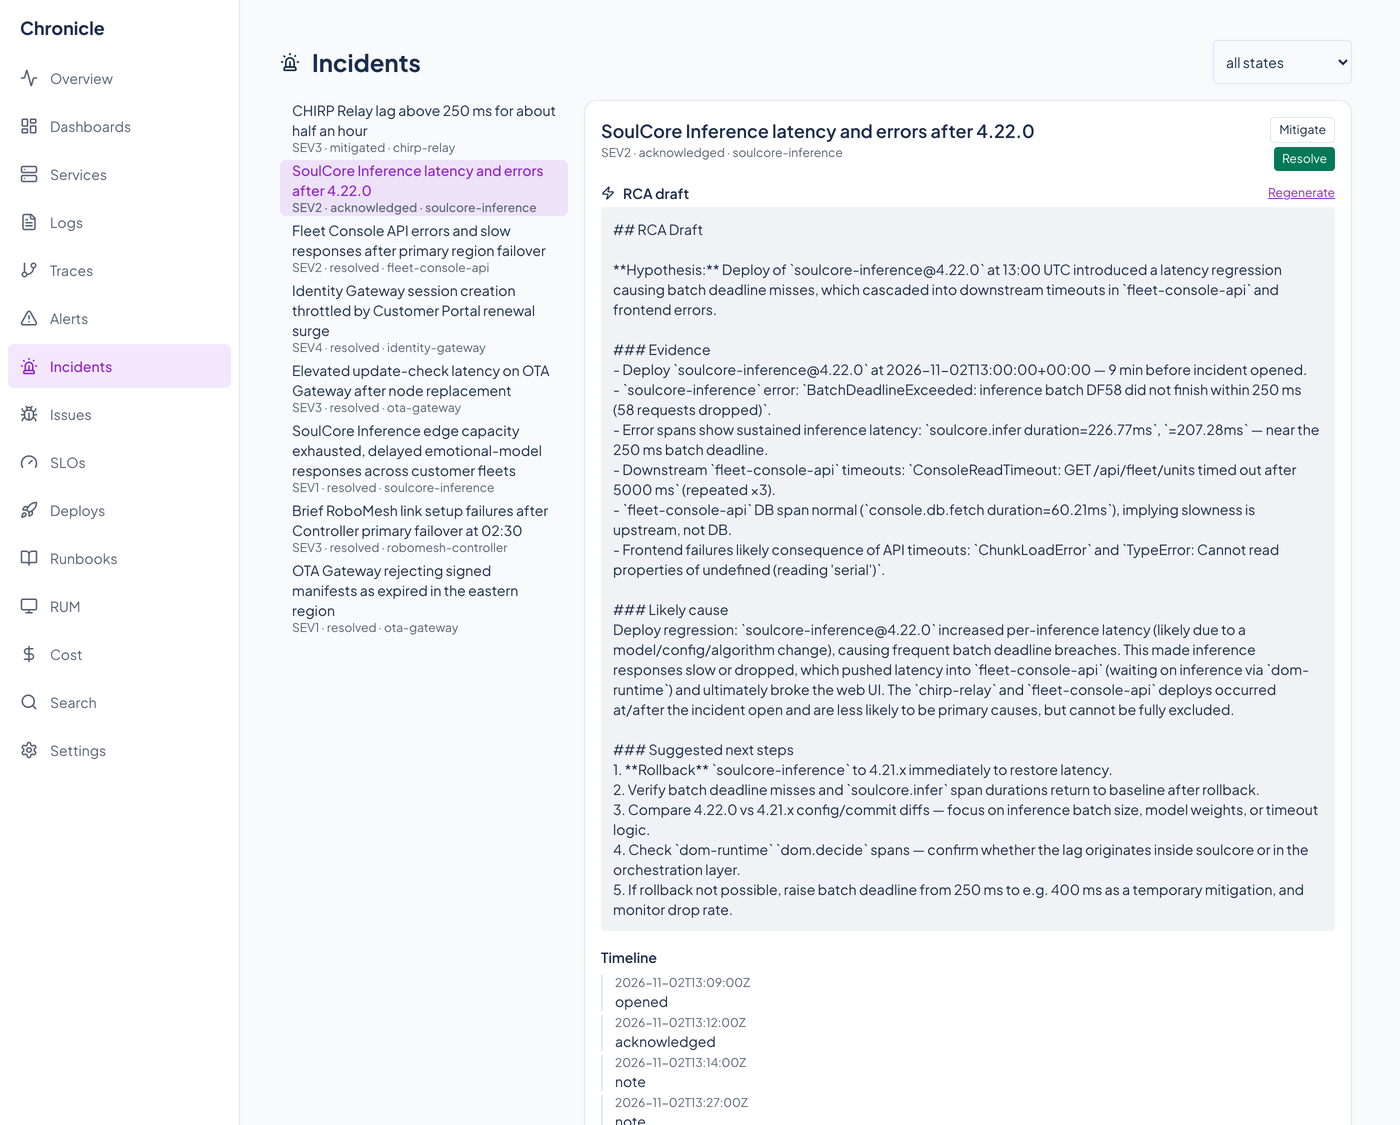
Incidents

Chronicle's Incidents page with a drafted root cause.Chronicle's Incidents page with a drafted root cause.
Severity, service, state, and timestamps for each incident, with a drafted root-cause write-up. Enlarge to see the full screen.

Issues

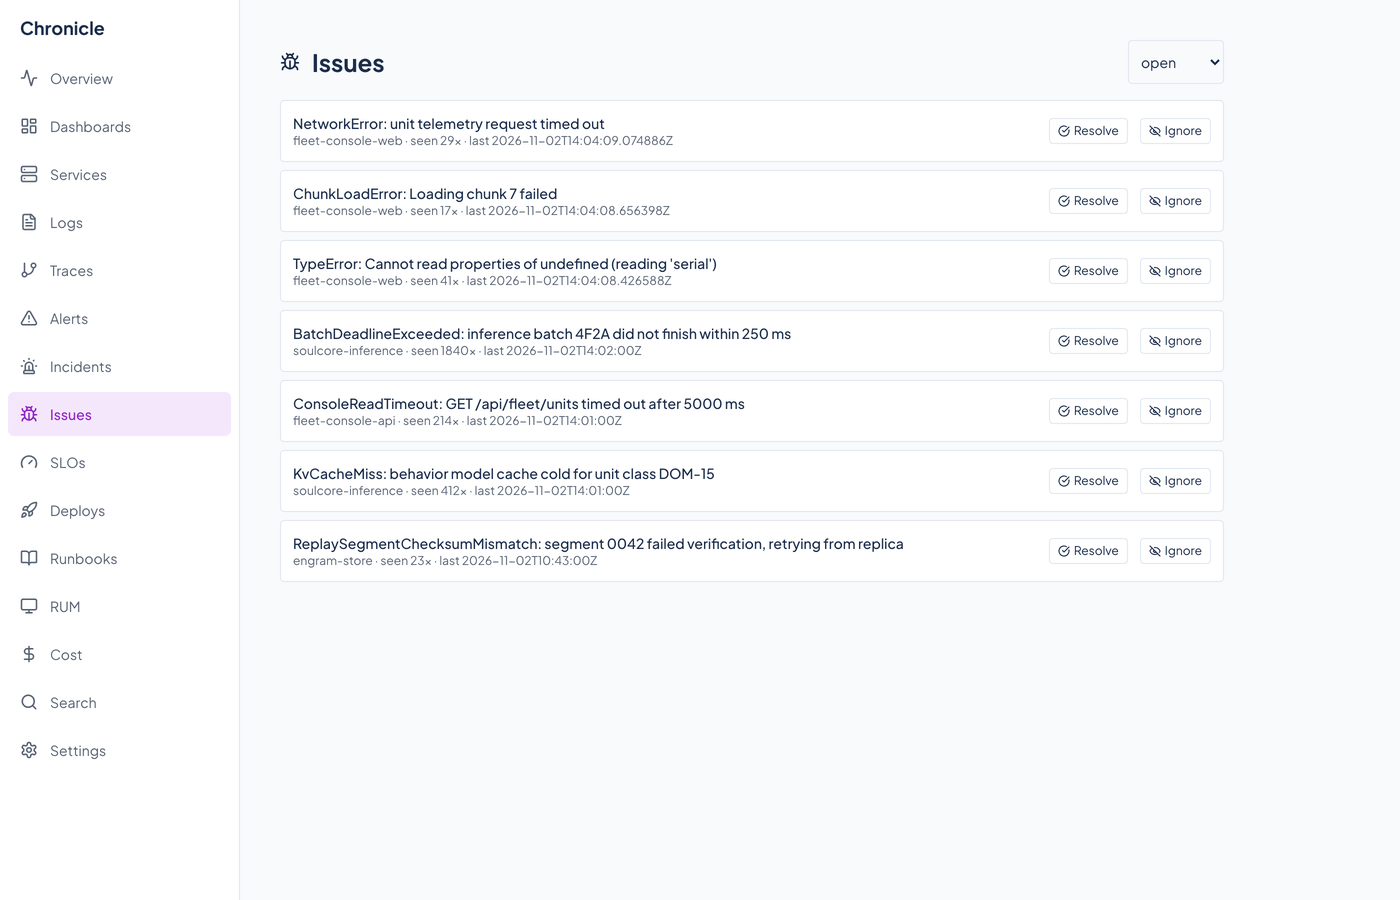
Chronicle's Issues page with grouped errors.Chronicle's Issues page with grouped errors.
Errors grouped by fingerprint, each with its service, an occurrence count, and when it was last seen. Resolve or ignore one from here.

SLOs

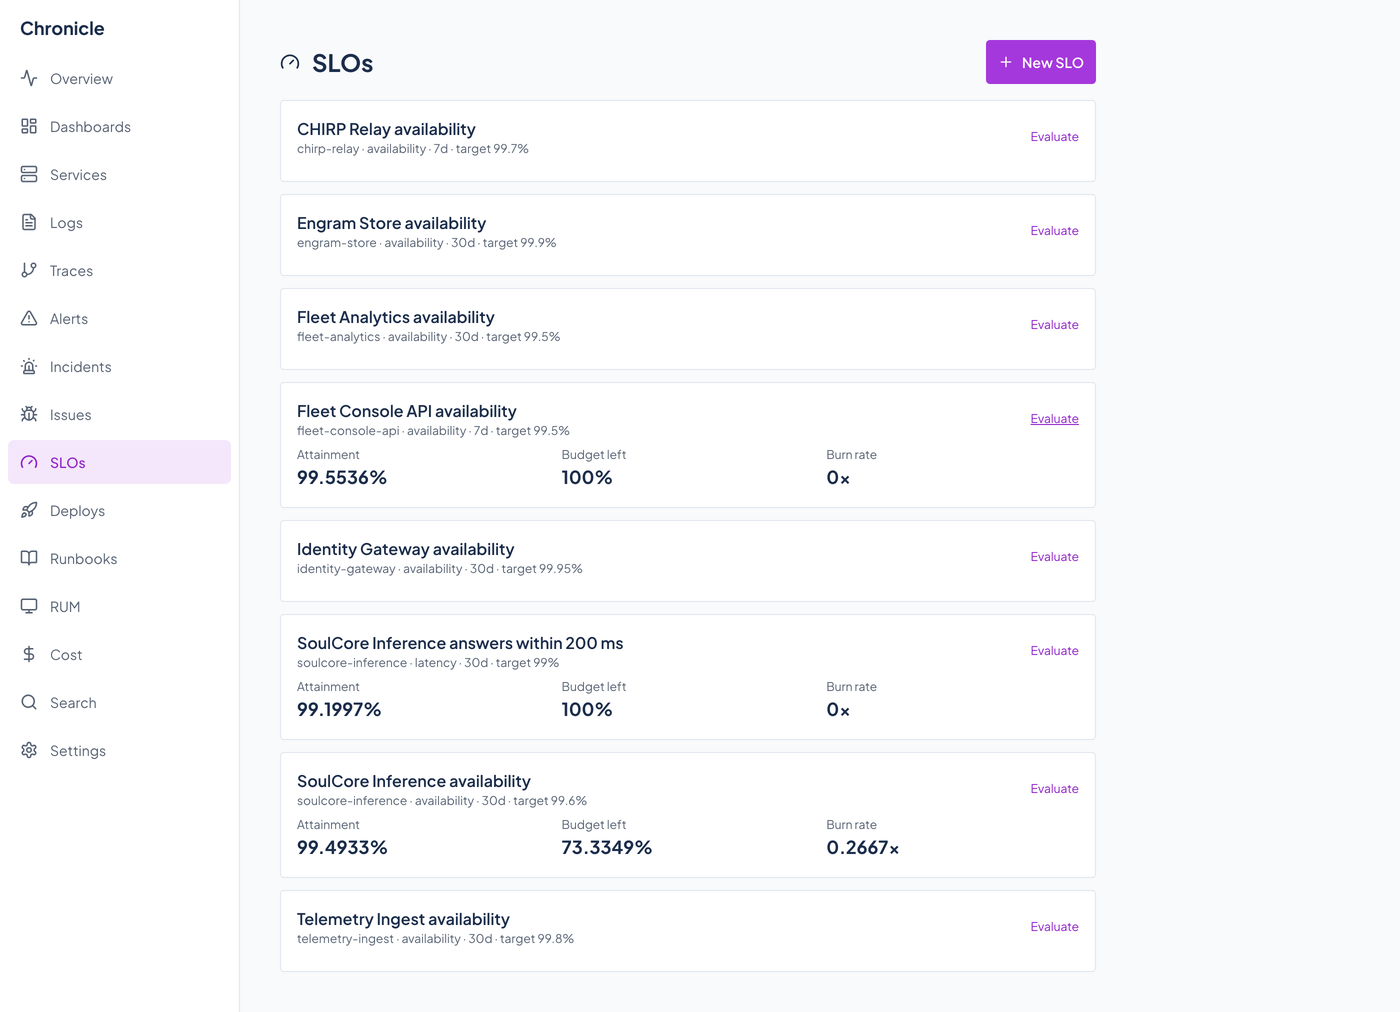
Chronicle's SLOs page with attainment and error budget.Chronicle's SLOs page with attainment and error budget.
Each objective with its window and target. Evaluate one to see its attainment, the error budget remaining, and the burn rate.

Dashboards

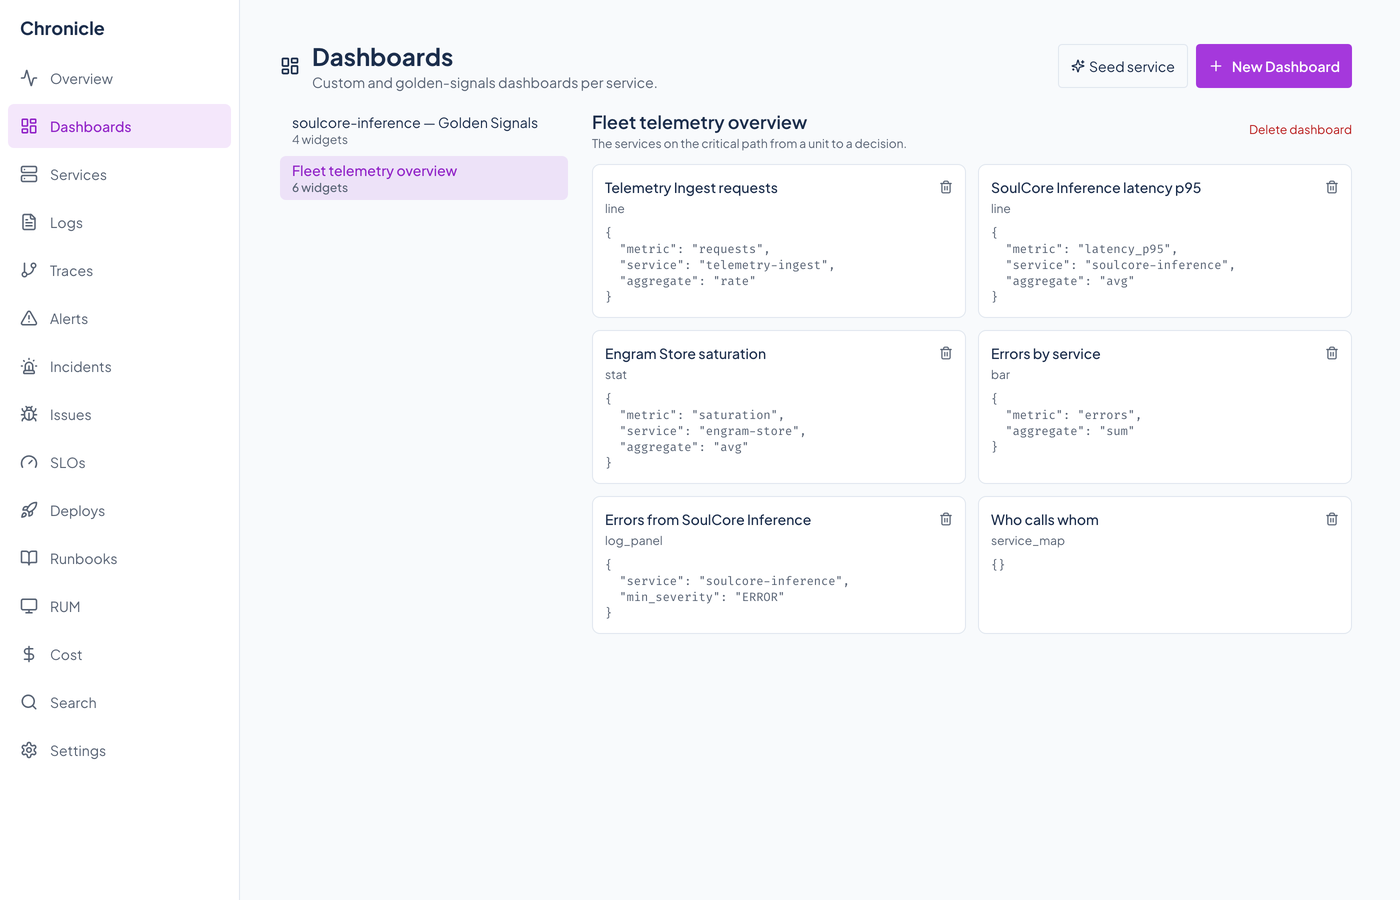
Chronicle's Dashboards page with widgets.Chronicle's Dashboards page with widgets.
A dashboard's widgets, each a saved metric, log, or trace query shown with its query. Enlarge to see the full screen.

Deploys

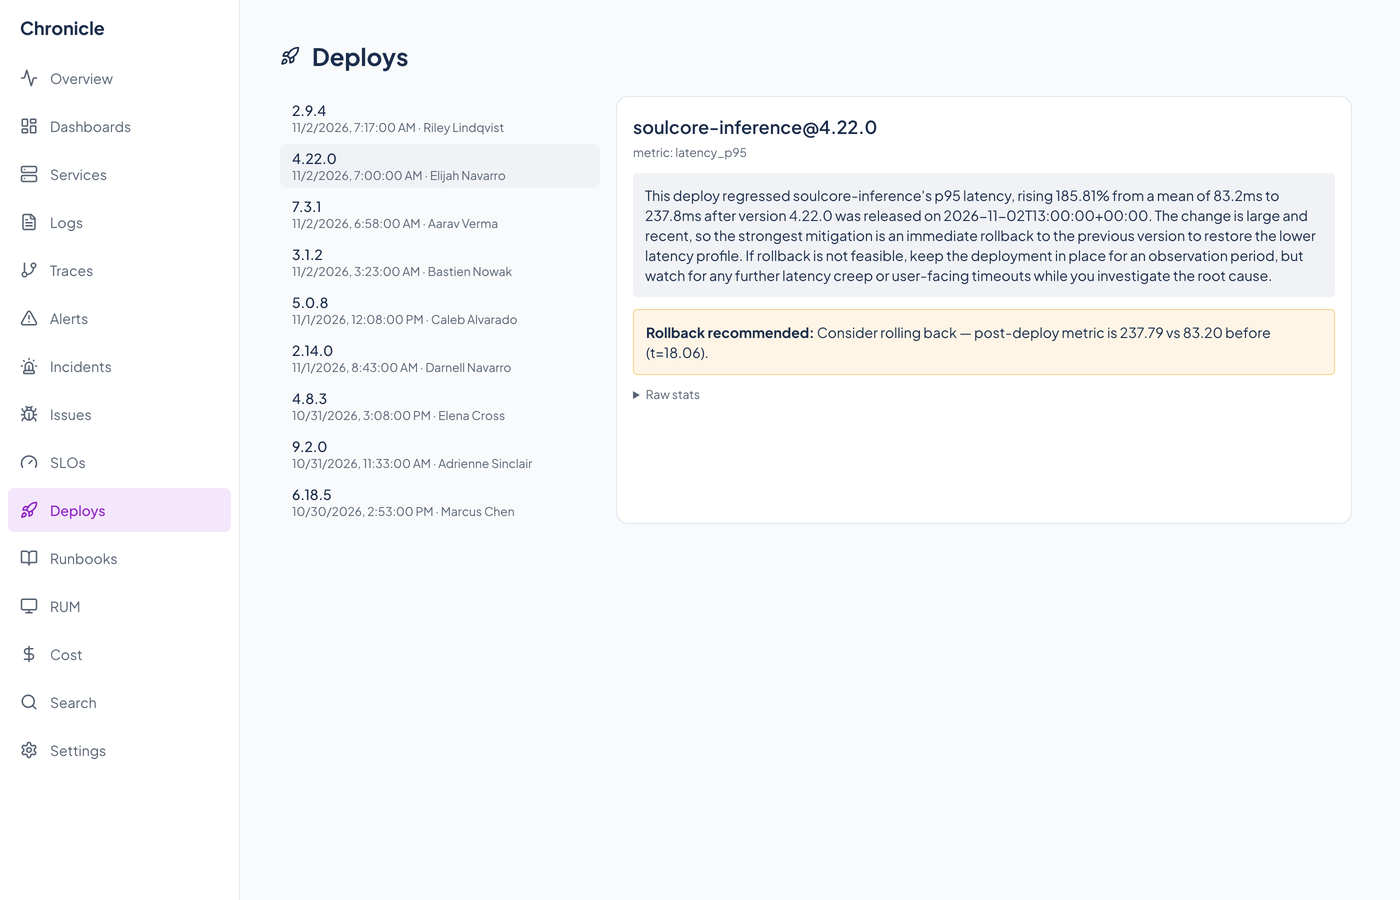
Chronicle's Deploys page with a deploy timeline.Chronicle's Deploys page with a deploy timeline.
Recorded deploys by version, time, and author, with the before-and-after impact check and a rollback hint.

Cost

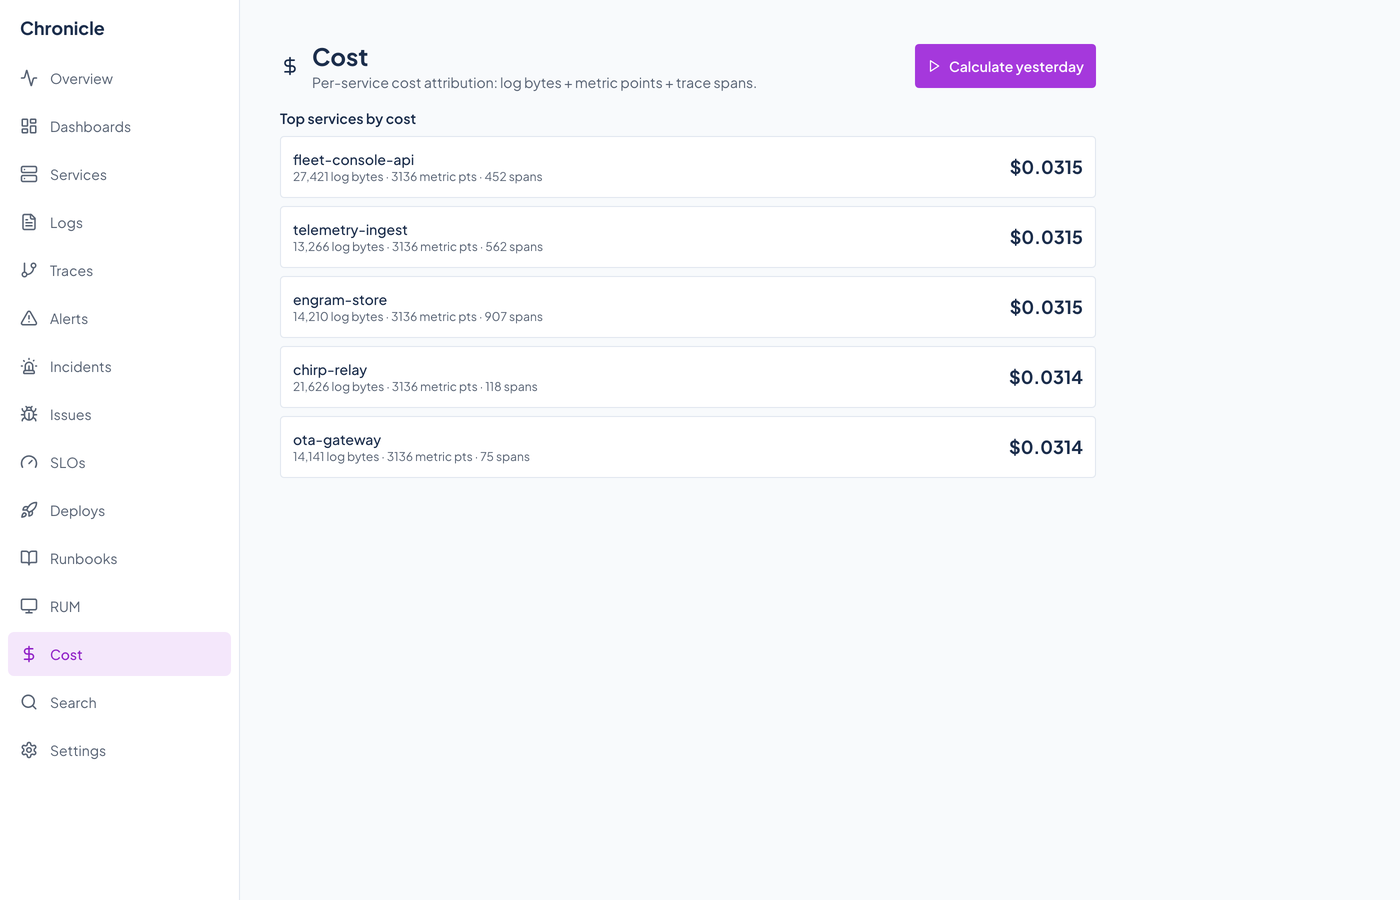
Chronicle's Cost page attributing storage cost to services.Chronicle's Cost page attributing storage cost to services.
Storage cost attributed to the service that produced the log volume, metric series, and spans.

Real-user monitoring

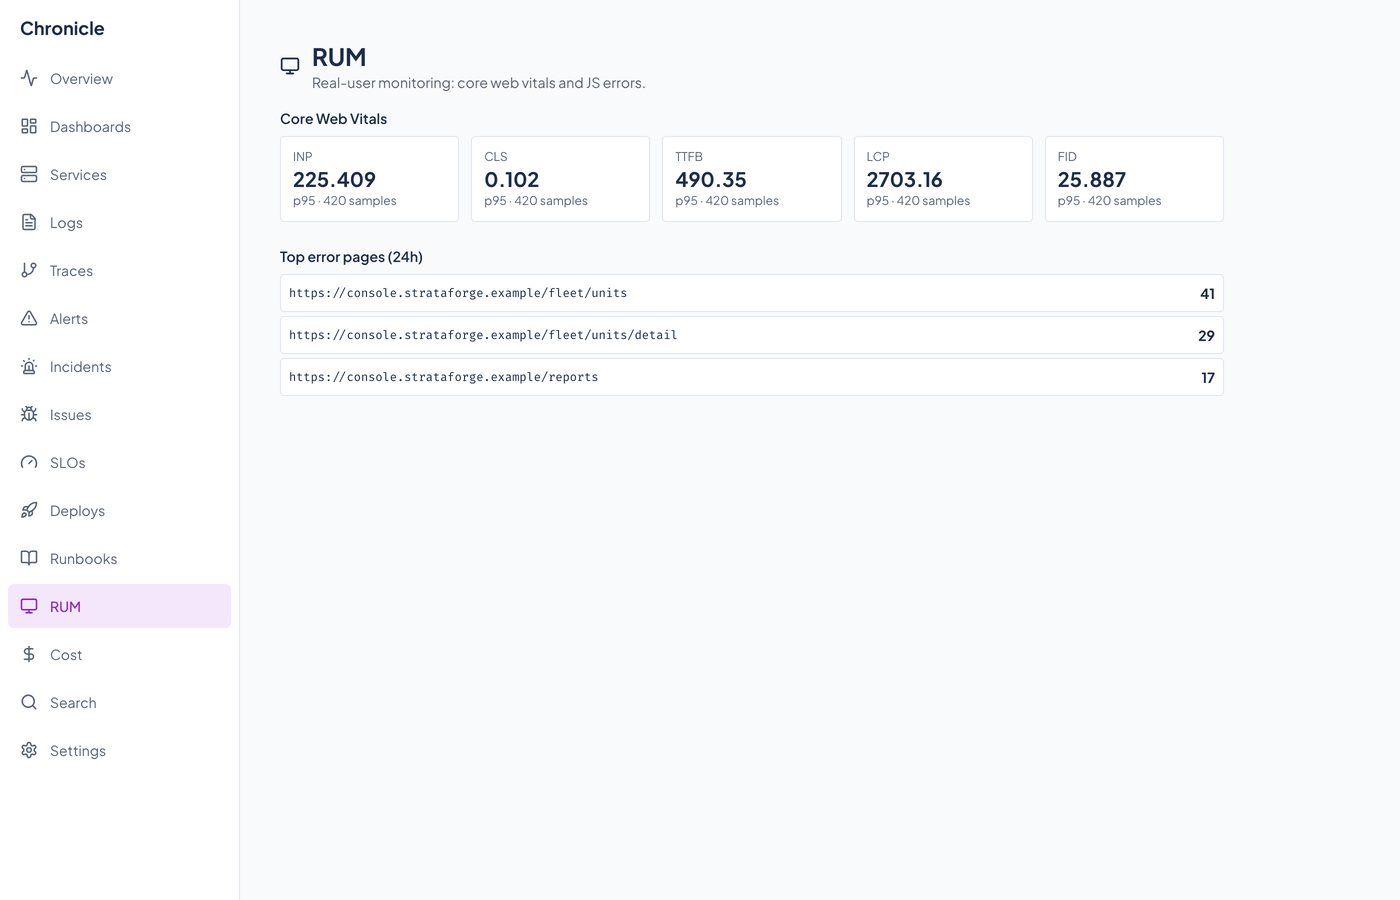
Chronicle's RUM page with web vitals and errors.Chronicle's RUM page with web vitals and errors.
Core Web Vitals and JavaScript errors from real browser sessions.

Runbooks

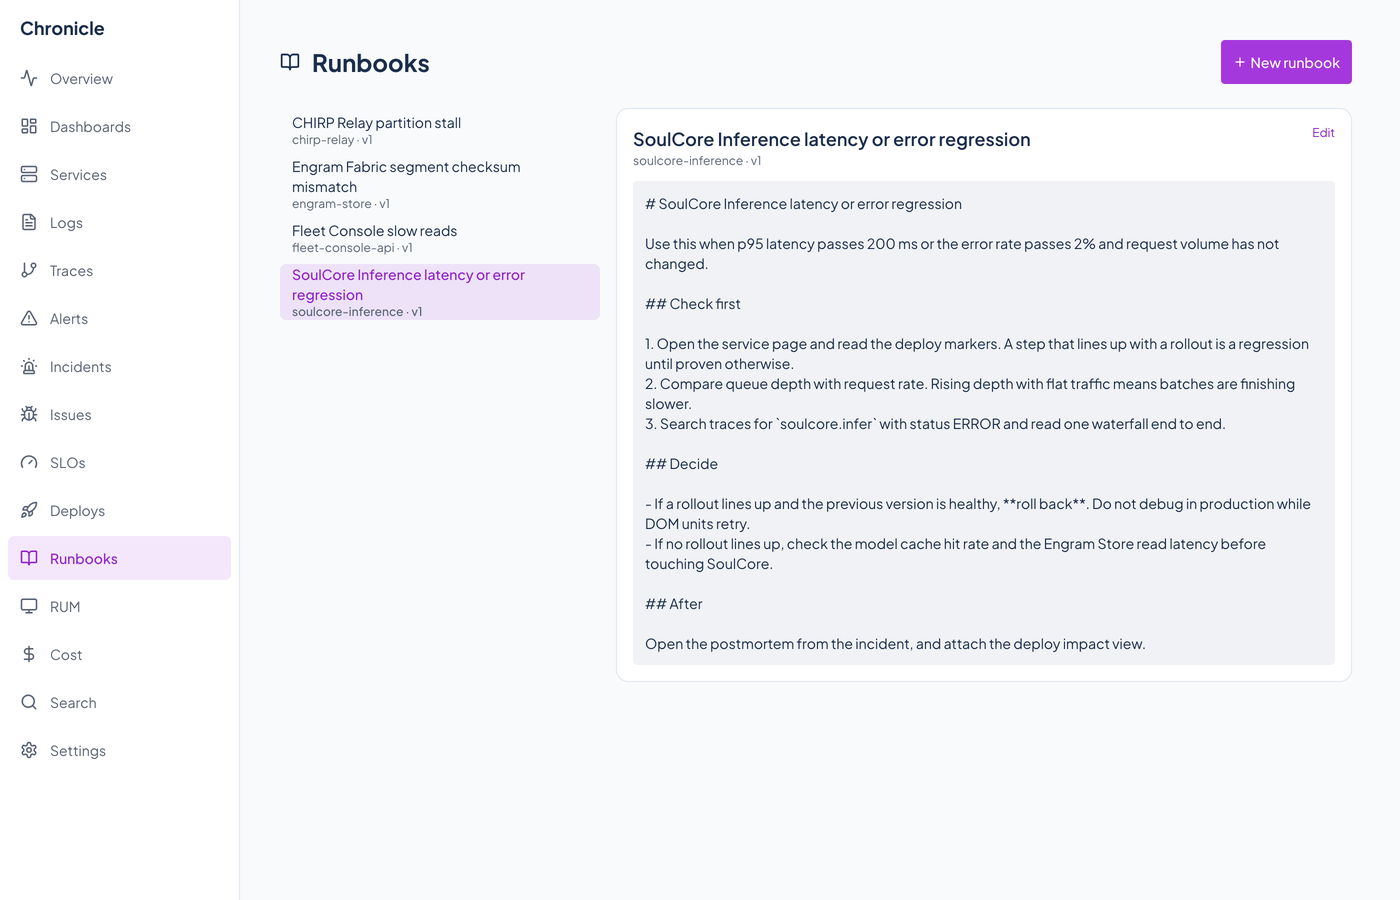
Chronicle's Runbooks page listing playbooks.Chronicle's Runbooks page listing playbooks.
Playbooks tied to the alerts and services they answer.