
See everything. Correlate anything. Fix what matters.
Chronicle keeps metrics, logs, and traces side by side, with alerts, SLOs, and incidents on top, and drafts a root cause for any open incident nobody has acknowledged.
- Watch the film · 1:00
- Accessibility documented
- OpenTelemetry ingest
- 55 MCP tools

A release goes out, latency nearly triples, and somebody has to work out why.
Chronicle keeps metrics, logs, and traces together and walks the problem from an alert to an incident to a drafted root cause, with a person still pressing Mitigate and Resolve.
Read the film’s text version
Title: Chronicle. See everything. Correlate anything. Fix what matters. 2026. A bright, energized electronic score runs under the whole film, with a soft tick or hit on each action.
The release: “A release goes out.” A thin line of one-minute p95 latency readings for the SoulCore Inference service runs flat under a dashed 200 ms line, a flag labeled 4.22.0 drops where the line bends, and it climbs to about 2.9 times where it was. “Latency nearly triples.” Drawn from the real series, and marked as an illustration.
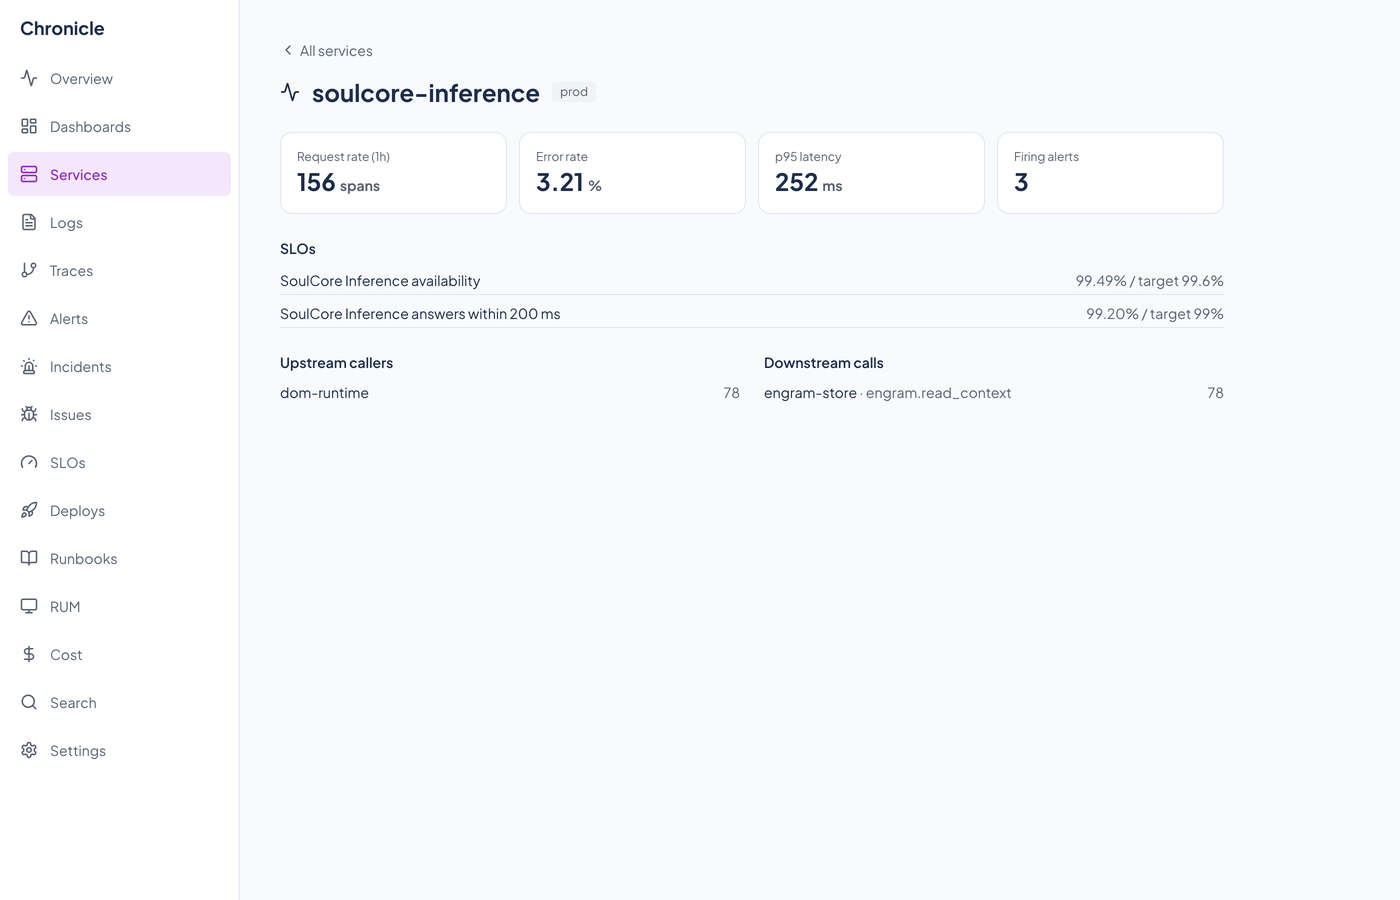
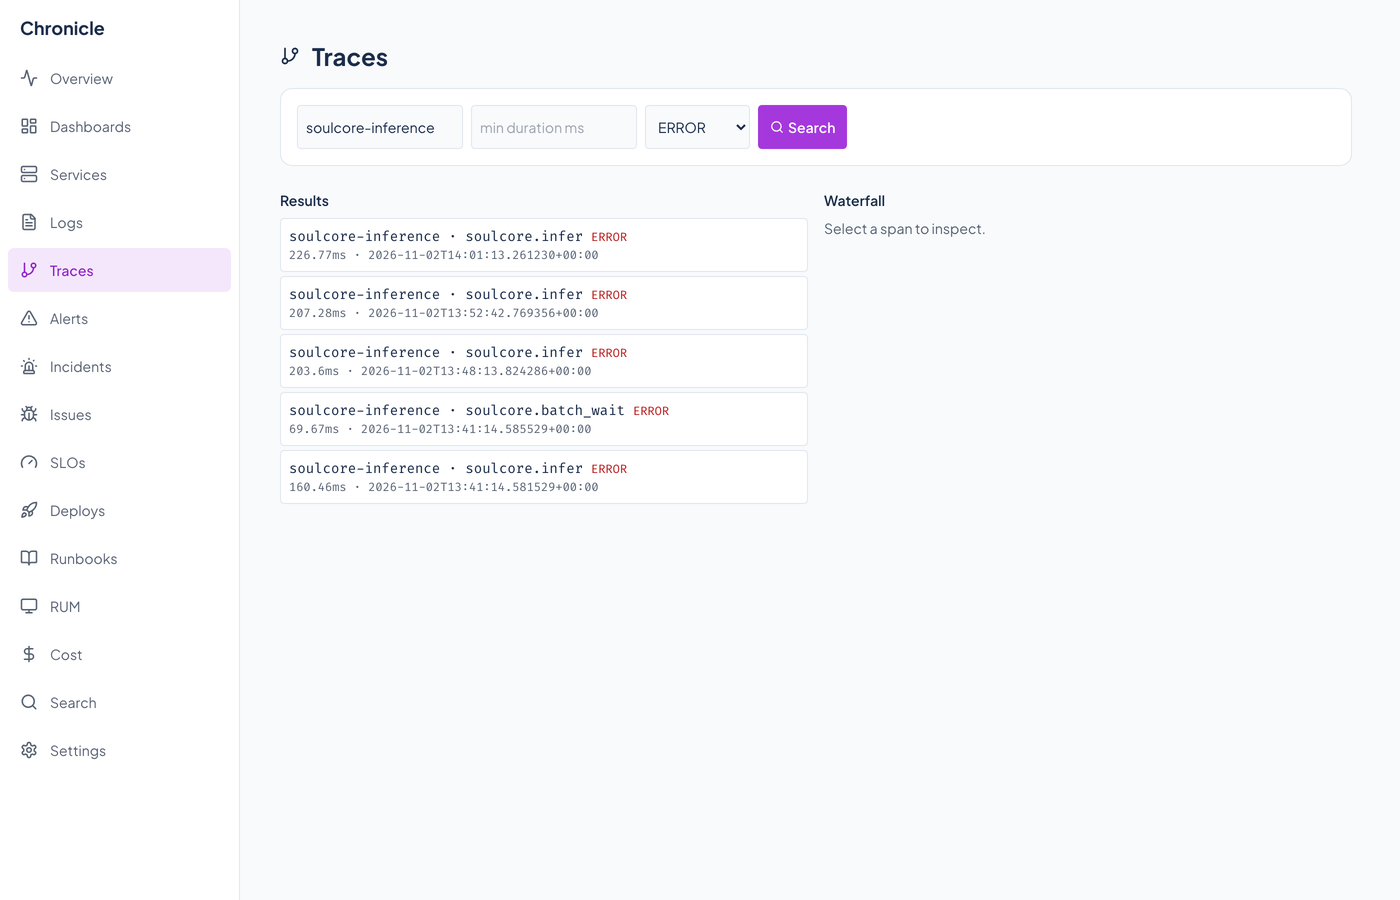
One place: As the beat drops: “Metrics. Logs. Traces.” Three of Chronicle's own panes slide in side by side: the service page with its p95 latency and SLO attainment, the Logs list with a trace id on its error lines, and the trace waterfall with its red bars. “One place for the evidence.”
What services emit: “Send what you already emit.” OpenTelemetry, Prometheus, StatsD, syslog, and the Python SDK wire into one Chronicle intake. Below it, a log line, “support ticket opened by unit.owner@example.com”, has its address turn into the marker [REDACTED_EMAIL], the product's own redaction, with the line “Log lines are redacted before they are written.” Drawn, and marked as an illustration.
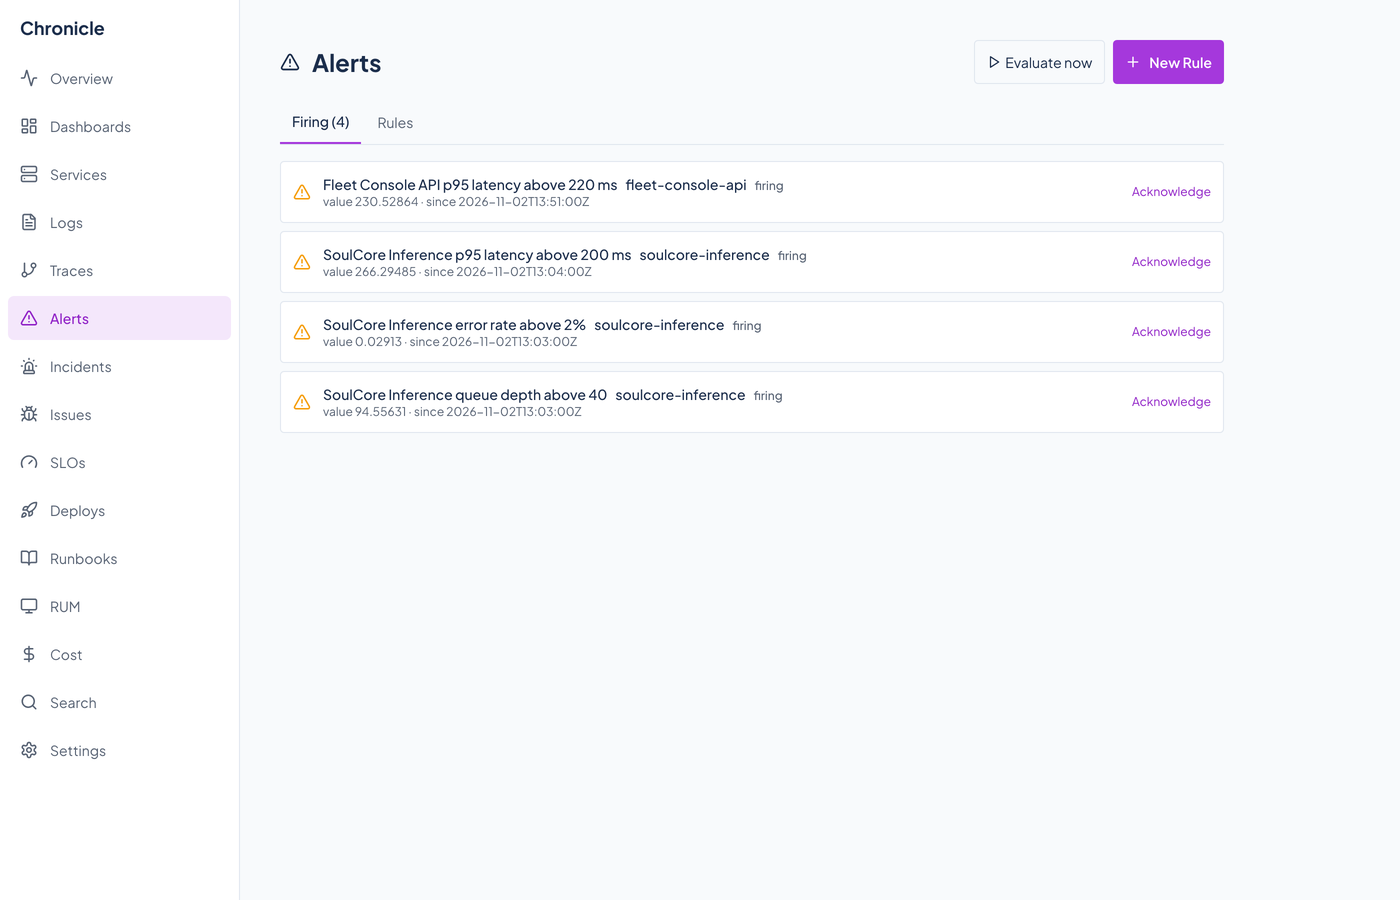
The alert: “Every ten seconds.” Chronicle's Alerts page lists four firing alerts; the row “SoulCore Inference p95 latency above 200 ms” is ringed and its value, 266 ms, counts up, with “A worker checks every rule every 10 seconds” and four marks for the four alerts. “Someone acknowledges.” The same page after Acknowledge reads Firing (3), one mark dims, and “Acknowledged alerts leave the Firing list.”
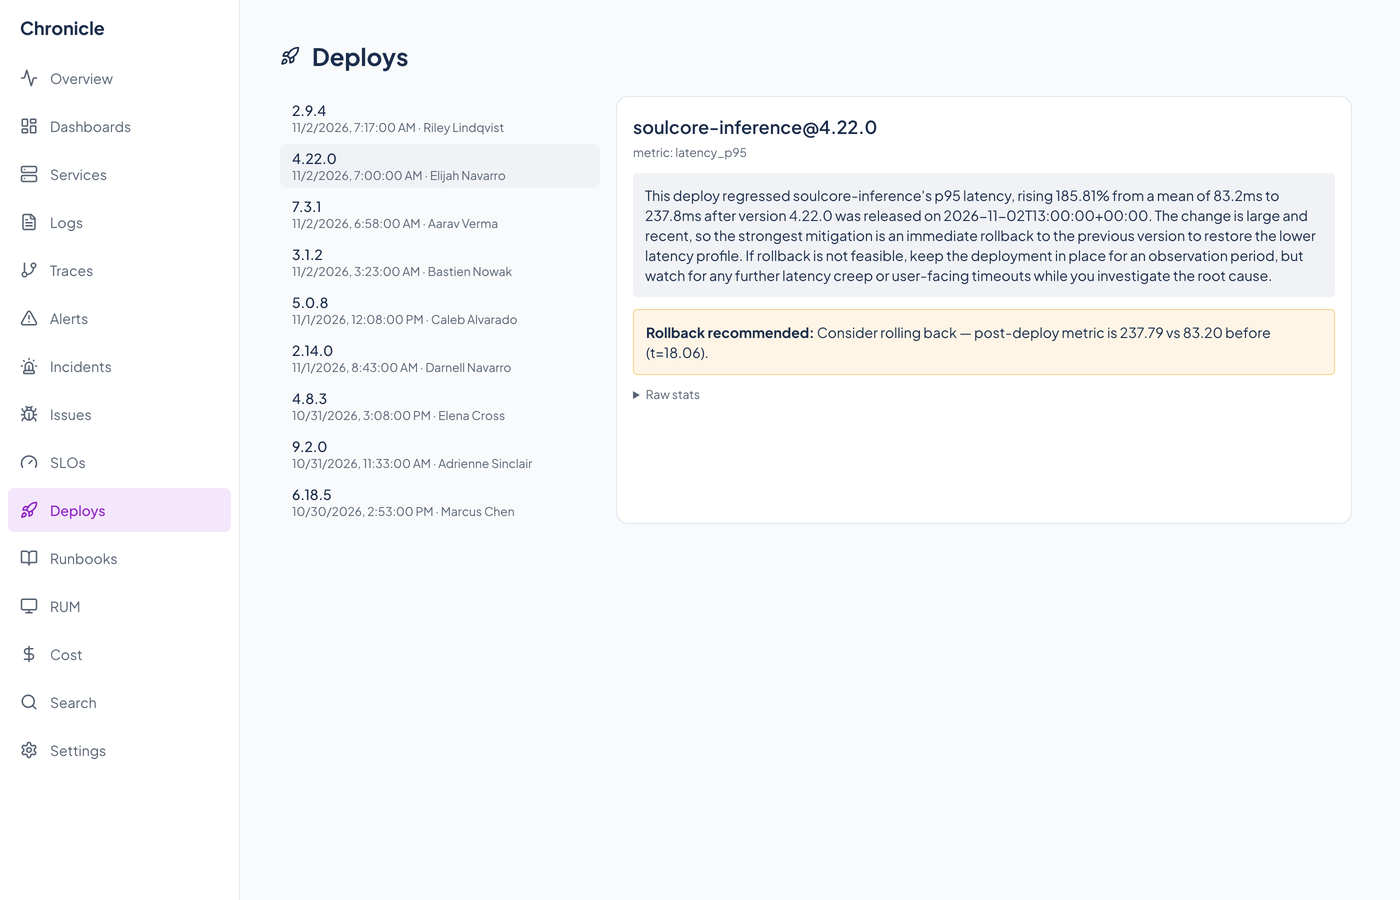
The deploy check: As the beat drops again: “Before. After.” Chronicle's Deploys page for soulcore-inference 4.22.0 is ringed while two numbers count up, 83.2 and 237.8 milliseconds, the mean p95 for 30 minutes either side, t = 18.06. “Chronicle suggests a rollback.” The page's own amber box is ringed, and “Rollback recommended” lands.
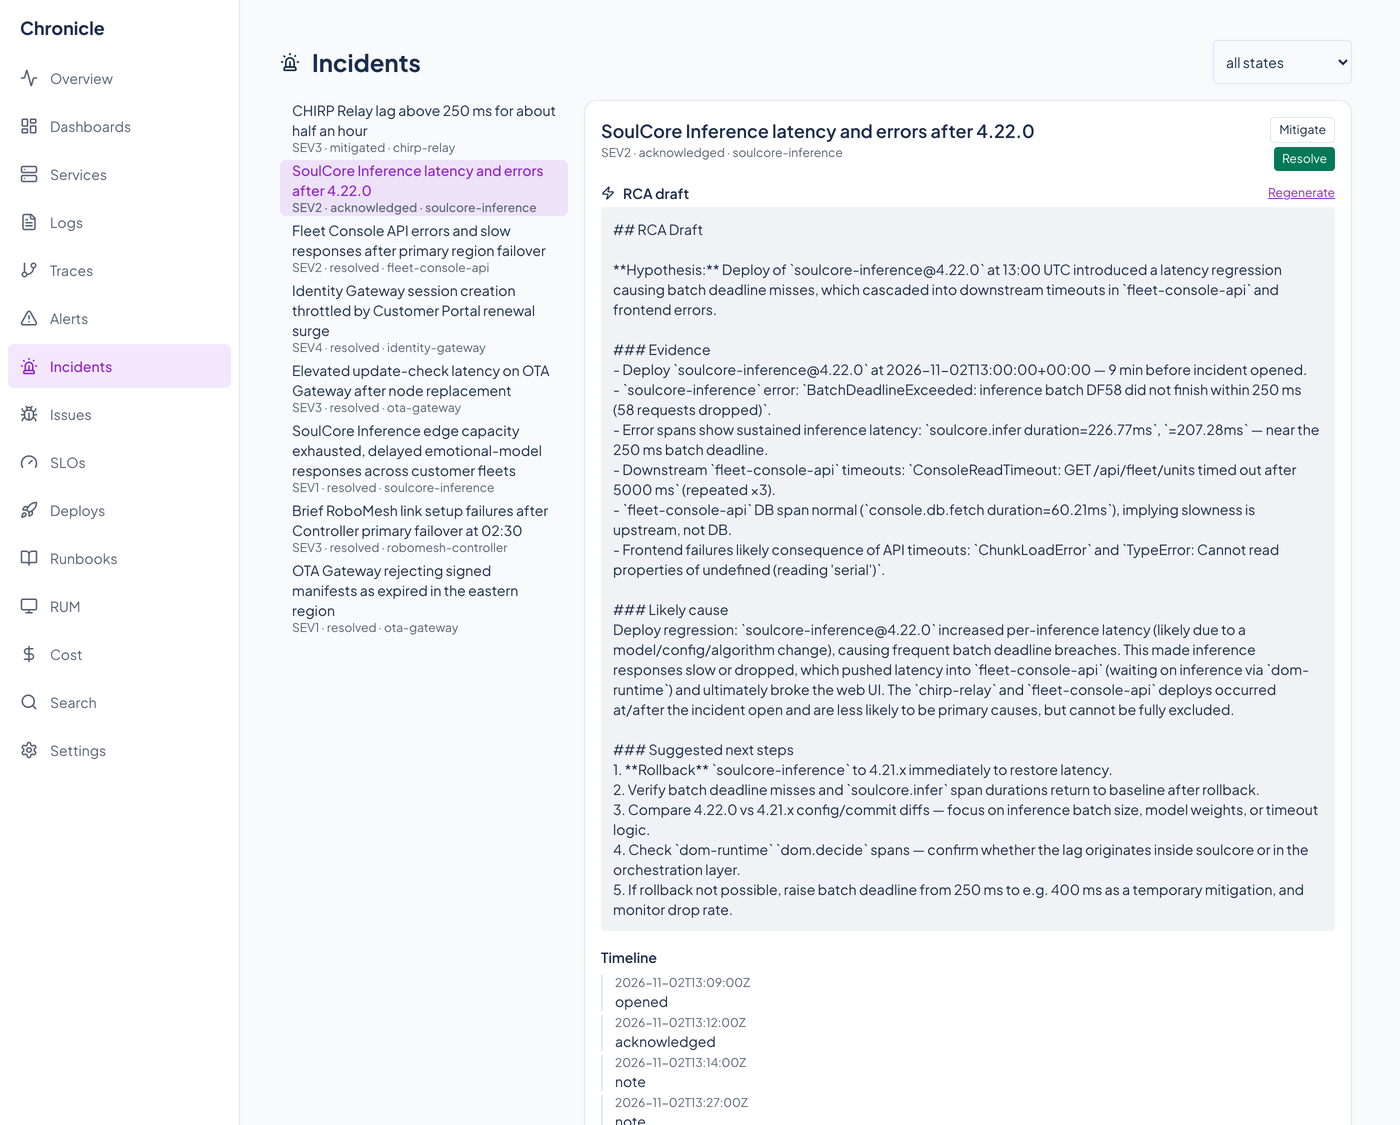
The incident: “Open an incident.” Three ways are listed, the API, the open_incident agent tool, and a Vigil sync, with “No alert opens one by itself.” Chronicle's Incidents page shows the SEV2 incident, acknowledged, opened nine minutes after the deploy, ringed. “Drafted from the evidence.” One mark lands for each item the drafter sends a model: three deploys from the last two hours, six error logs, and six error spans from the last thirty minutes, fifteen in all, plus the incident's title and service.
The draft: “A draft.” The incident's drafted root cause scrolls by while four chips light, Hypothesis, Evidence, Likely cause, and Suggested next steps, and the first next step, a rollback, is ringed. “Nothing moves by itself.” Regenerate and the Mitigate and Resolve buttons are ringed: “A responder or an agent presses Mitigate and Resolve. The draft changes nothing by itself.” The chips are drawn and marked as an illustration; the draft is the model's own text and the film quotes none of it.
Agents: “Agents work it too.” Fifty-five marks fill a grid, one per MCP tool, and four are lit as their names list: list_firing_alerts, open_incident, draft_rca, and get_incident, with the count “55 MCP tools.” Drawn, and marked as an illustration.
The end: The Chronicle mark, “See everything. Correlate anything. Fix what matters.”, the site's address, and “Questions: fleet@renkara.com”, on the final chord.
Three signals, one place, and the work built on them.
Chronicle stores metrics, logs, and traces together and builds alerts, SLOs, issues, and incidents on top. These are the things it does today.
Metrics, logs, and traces, side by side
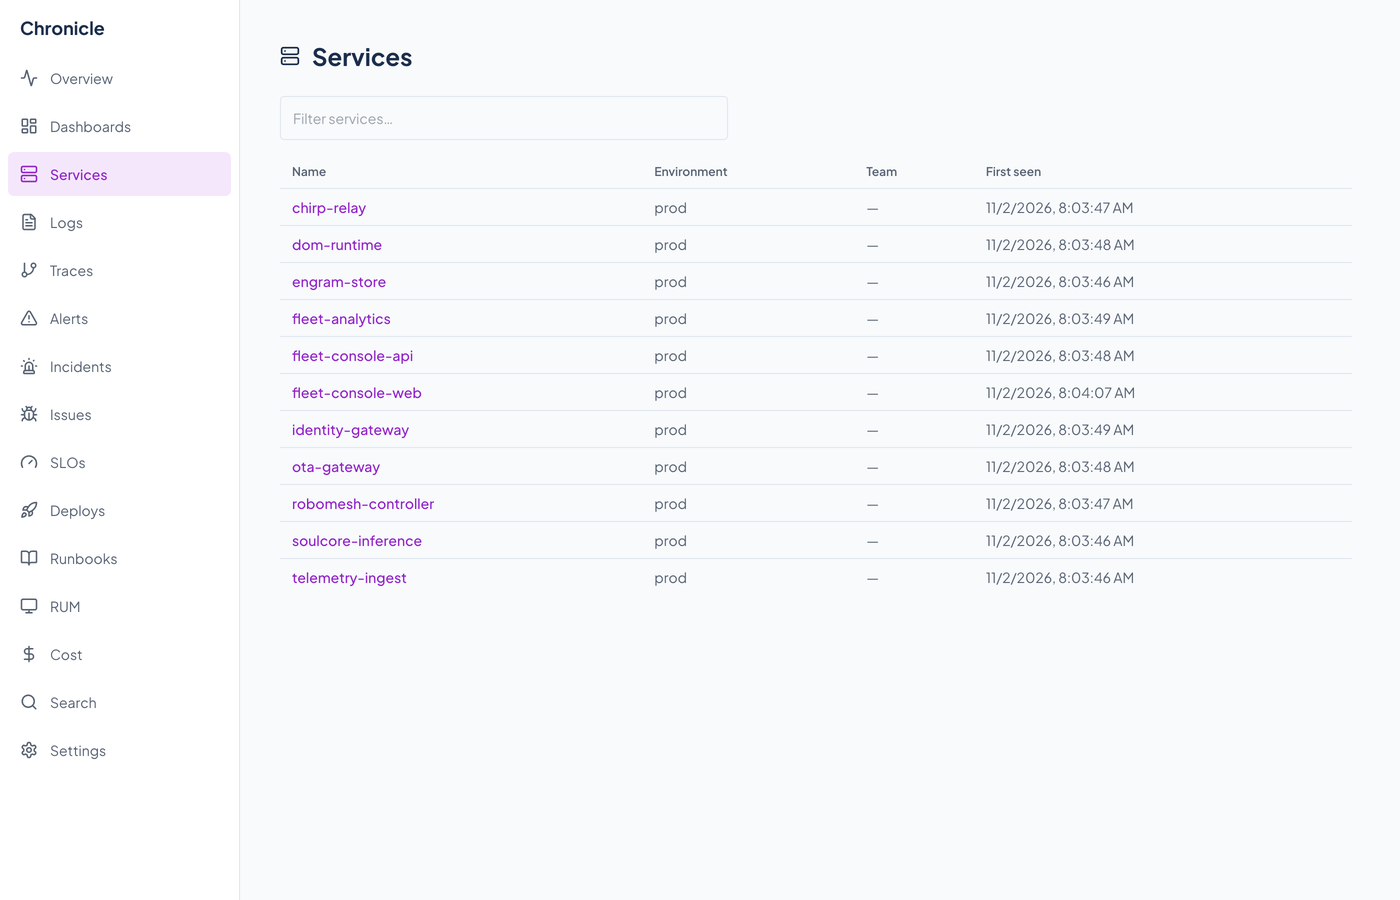
Services found for you
Any service that sends a metric, log, or trace gets a row in the Services catalog. Nothing to register first.
- Metrics
- Points are stored with their labels and queried with a small PromQL-style language: rate, sum, avg, max, min, and count, plus arithmetic between them. Request latency percentiles are answered from spans.
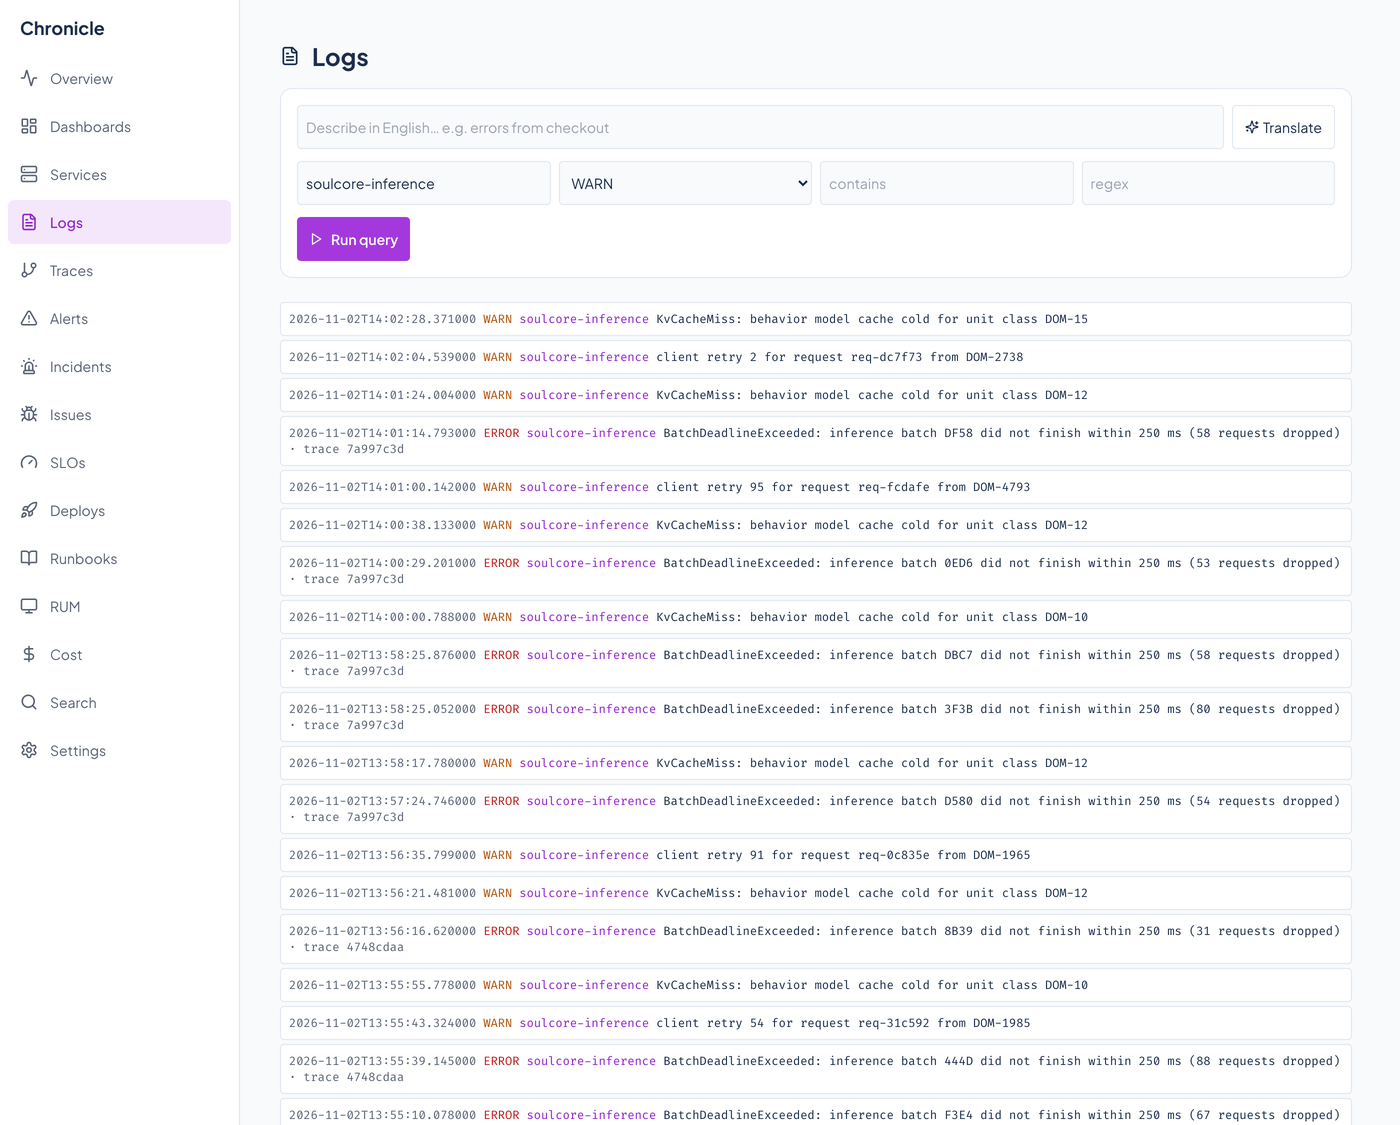
Structured logs
Every line keeps its severity, body, attributes, trace id, and span id. Query by any of them. A line from a traced request carries its trace id, so the whole trace is one lookup away through the API or the MCP get_trace tool. The Logs page shows the trace id as plain text, not a link.
- Redaction at ingest
- Before a log line is stored, card-shaped numbers, Social Security numbers, JSON Web Tokens, and email addresses are replaced with a marker. The original is not kept.
- Batches wait while the store is down
- If ClickHouse is unavailable, ingest parks batches in Valkey (up to 64 MiB by default) and writes them back when it returns. Once the spool is full, ingest refuses new batches with a retryable 503, and a Valkey restart without persistence loses what was waiting. Delivery is at least once, so a batch can arrive twice.
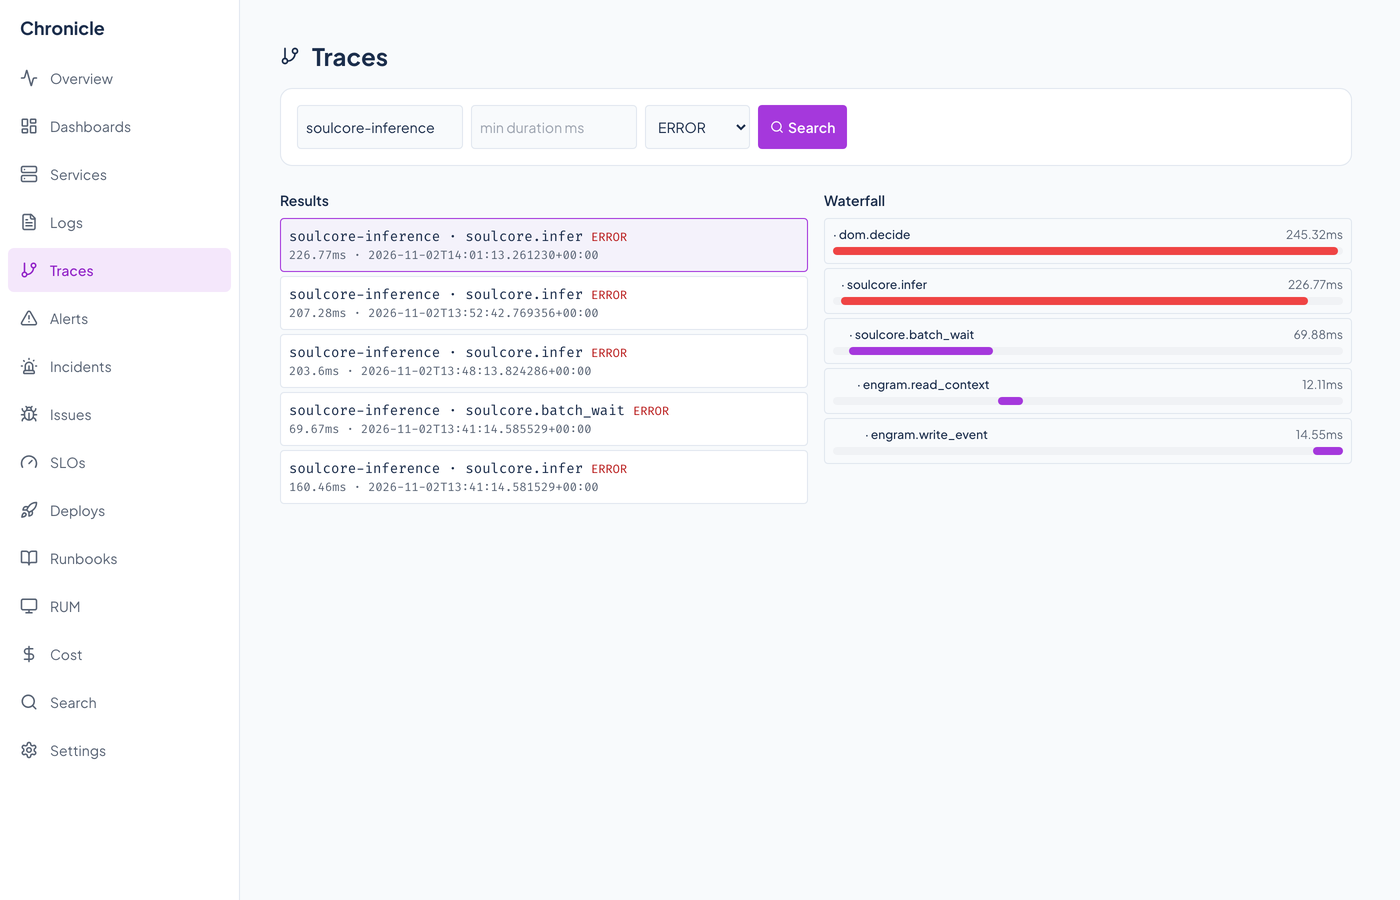
Distributed traces
Spans keep their parent, operation, kind, status, duration, and attributes. The Traces page draws a waterfall, and a service map and each service's callers and calls are derived from the spans.
OpenTelemetry first, and the formats you already have
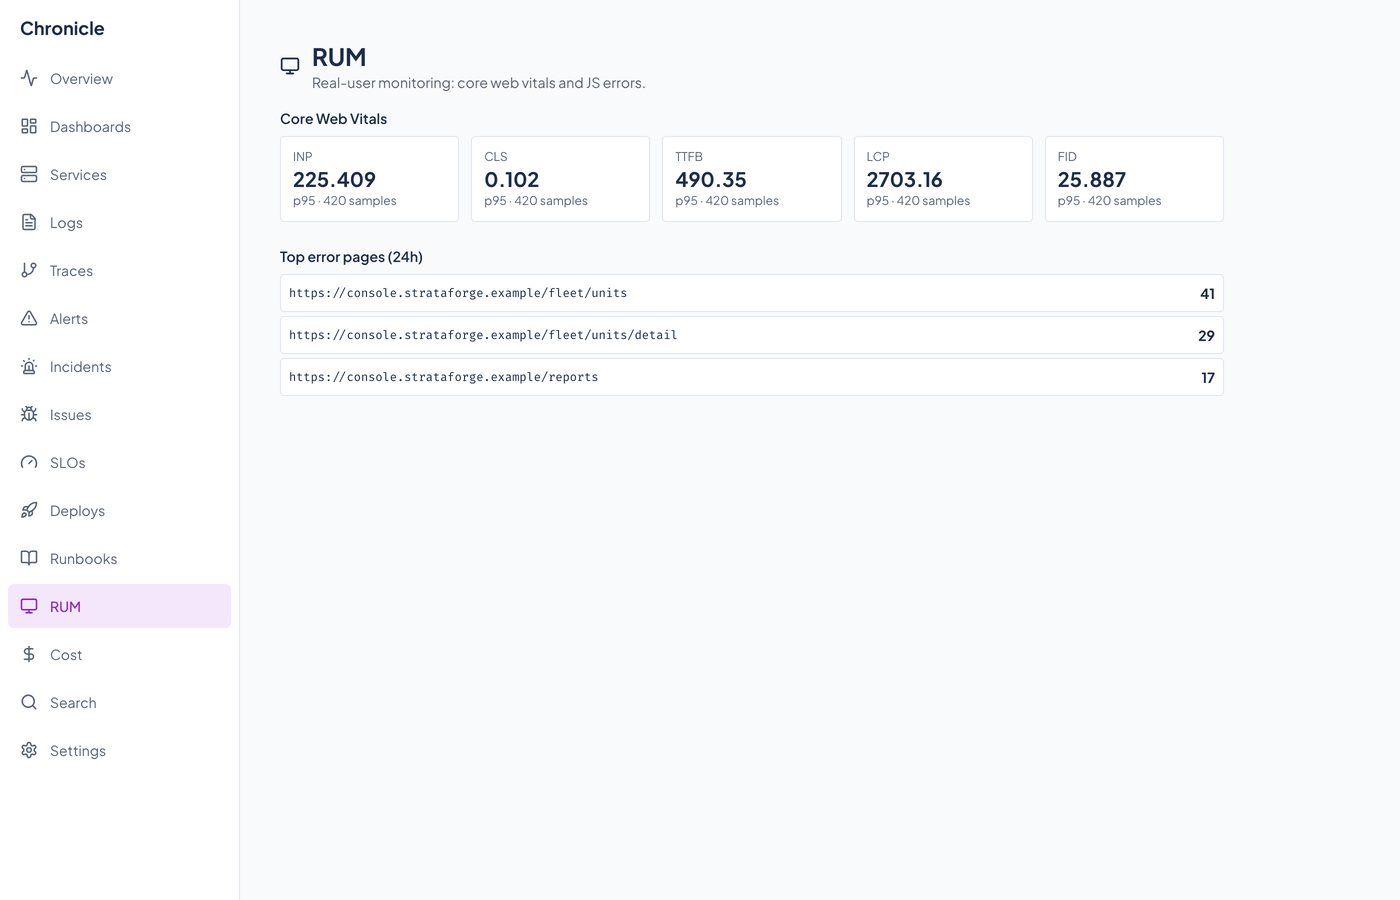
A browser beacon
One script tag captures Core Web Vitals (LCP, FID, INP, CLS, FCP, TTFB), JavaScript errors, page views, and route changes. Page addresses leave the browser as origin and path only, and credential-looking segments are replaced.
- OTLP over HTTP and JSON
- Receivers for metrics, logs, and traces take OpenTelemetry's JSON encoding. Any OpenTelemetry exporter that can send OTLP over HTTP with JSON can point at them.
- A Python SDK
init_chronicle(service_name)wires OpenTelemetry to ship spans and metrics to Chronicle, and auto-instruments FastAPI, httpx, SQLAlchemy, asyncpg, and redis when their OpenTelemetry packages are installed. A log handler ships logs without blocking the service.- Prometheus remote write
- Point a Prometheus
remote_writeat Chronicle and its samples are stored as metric points. The snappy-compressed protobuf Prometheus sends is accepted, and so is a plain JSON form. - StatsD and syslog
- An optional UDP listener takes StatsD and DogStatsD lines (counters, gauges, timers, histograms, distributions, with tags). Another takes syslog over UDP and TCP, in both RFC 3164 and RFC 5424. Each starts only when its port is set.
Deploy markers
Record a deploy with its service and version and it lands on the Deploys timeline. Ask for its impact and Chronicle compares a metric before and after with a Welch's t-test, to say whether latency or errors moved.
From a threshold to an incident to a write-up
Alert rules
A rule names a metric, an aggregate, a comparison, a threshold, and how long the breach must last. A worker evaluates every rule every 10 seconds. Acknowledge a firing alert, or silence a rule for a while.
SLOs and error budgets
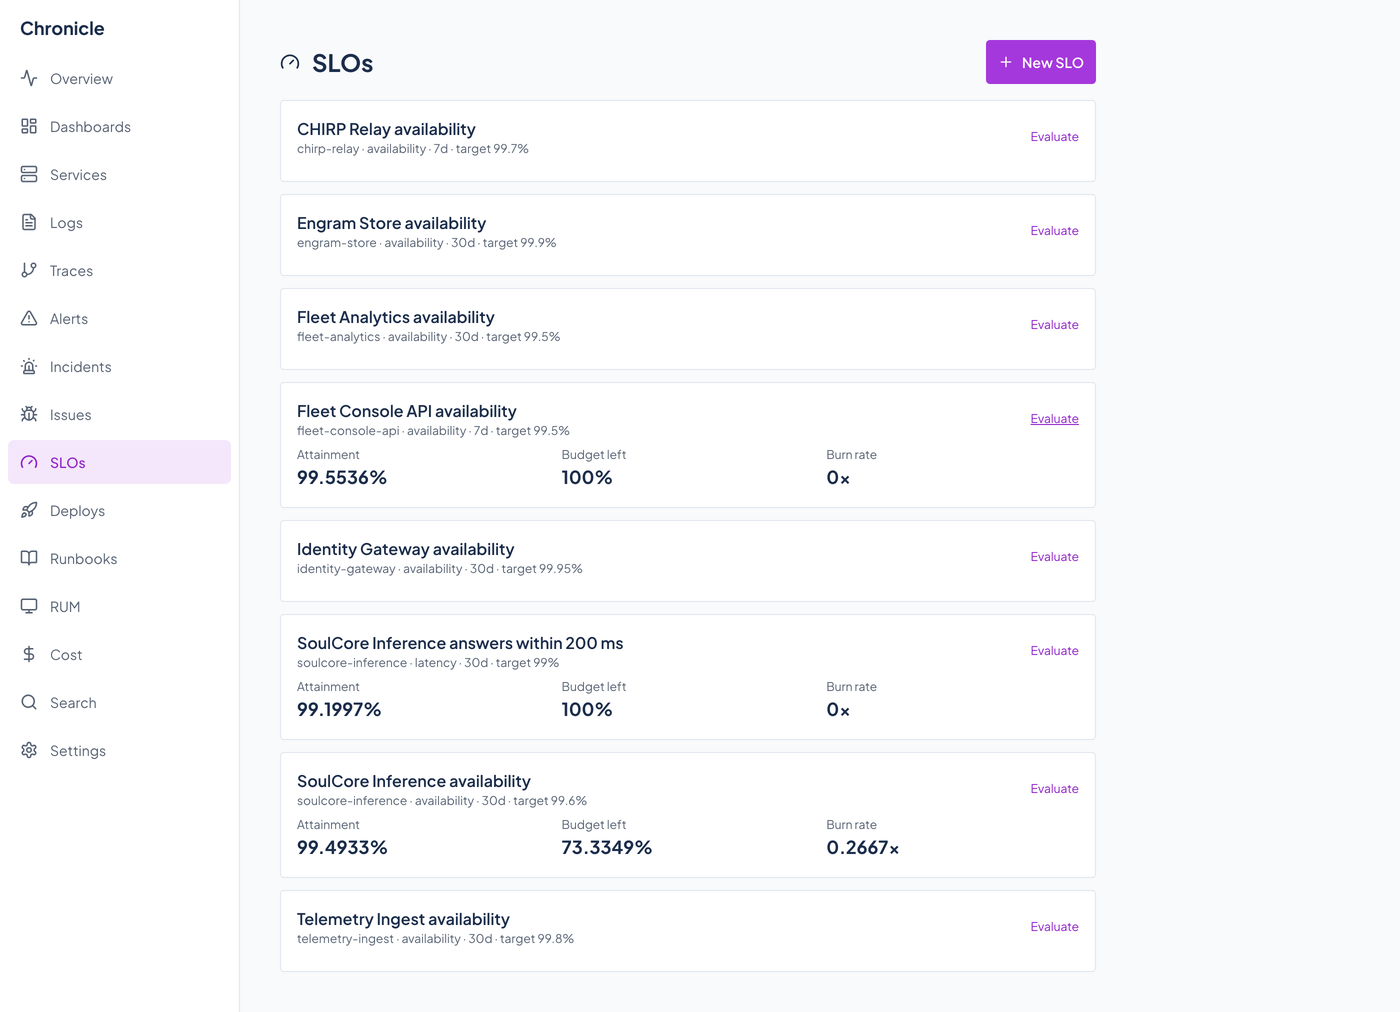
An objective over a 1-, 7-, 30-, or 90-day window is re-evaluated every minute for attainment, error budget remaining, and burn rate. A budget policy can open a Docket card or send a notification when the budget runs out; Docket does not accept Chronicle's cards yet.
Incidents with a timeline
Severity from SEV1 to SEV4. Open, acknowledged, mitigated, resolved, each transition timestamped, with notes and an incident commander.
A drafted root cause
Chronicle gathers deploys from the last 2 hours and error logs and error spans from the last 30 minutes, and has Mercury 3 draft a root-cause write-up. A background job drafts one for each open incident that lacks one. If the model cannot be reached, you get a plain draft of the same evidence, labeled as such.
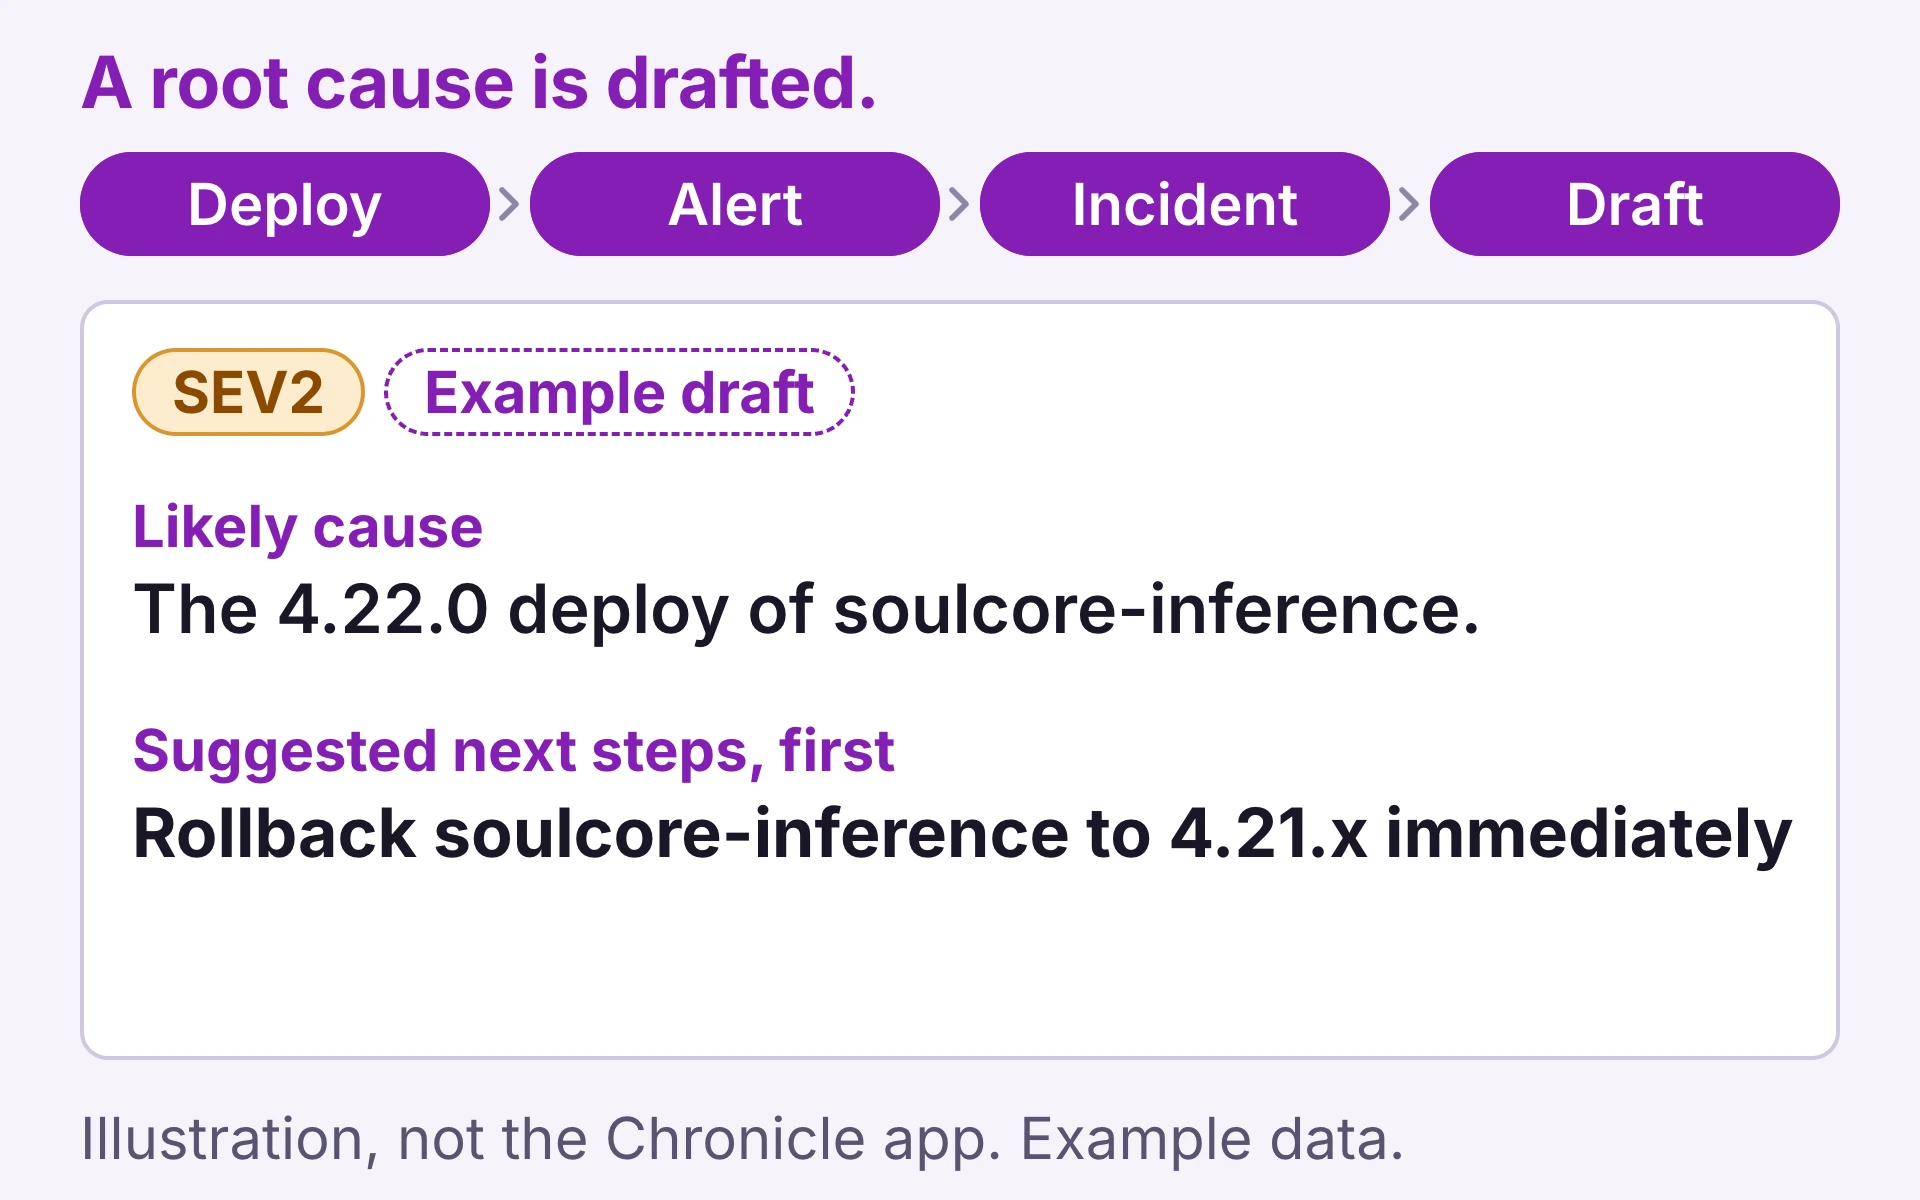
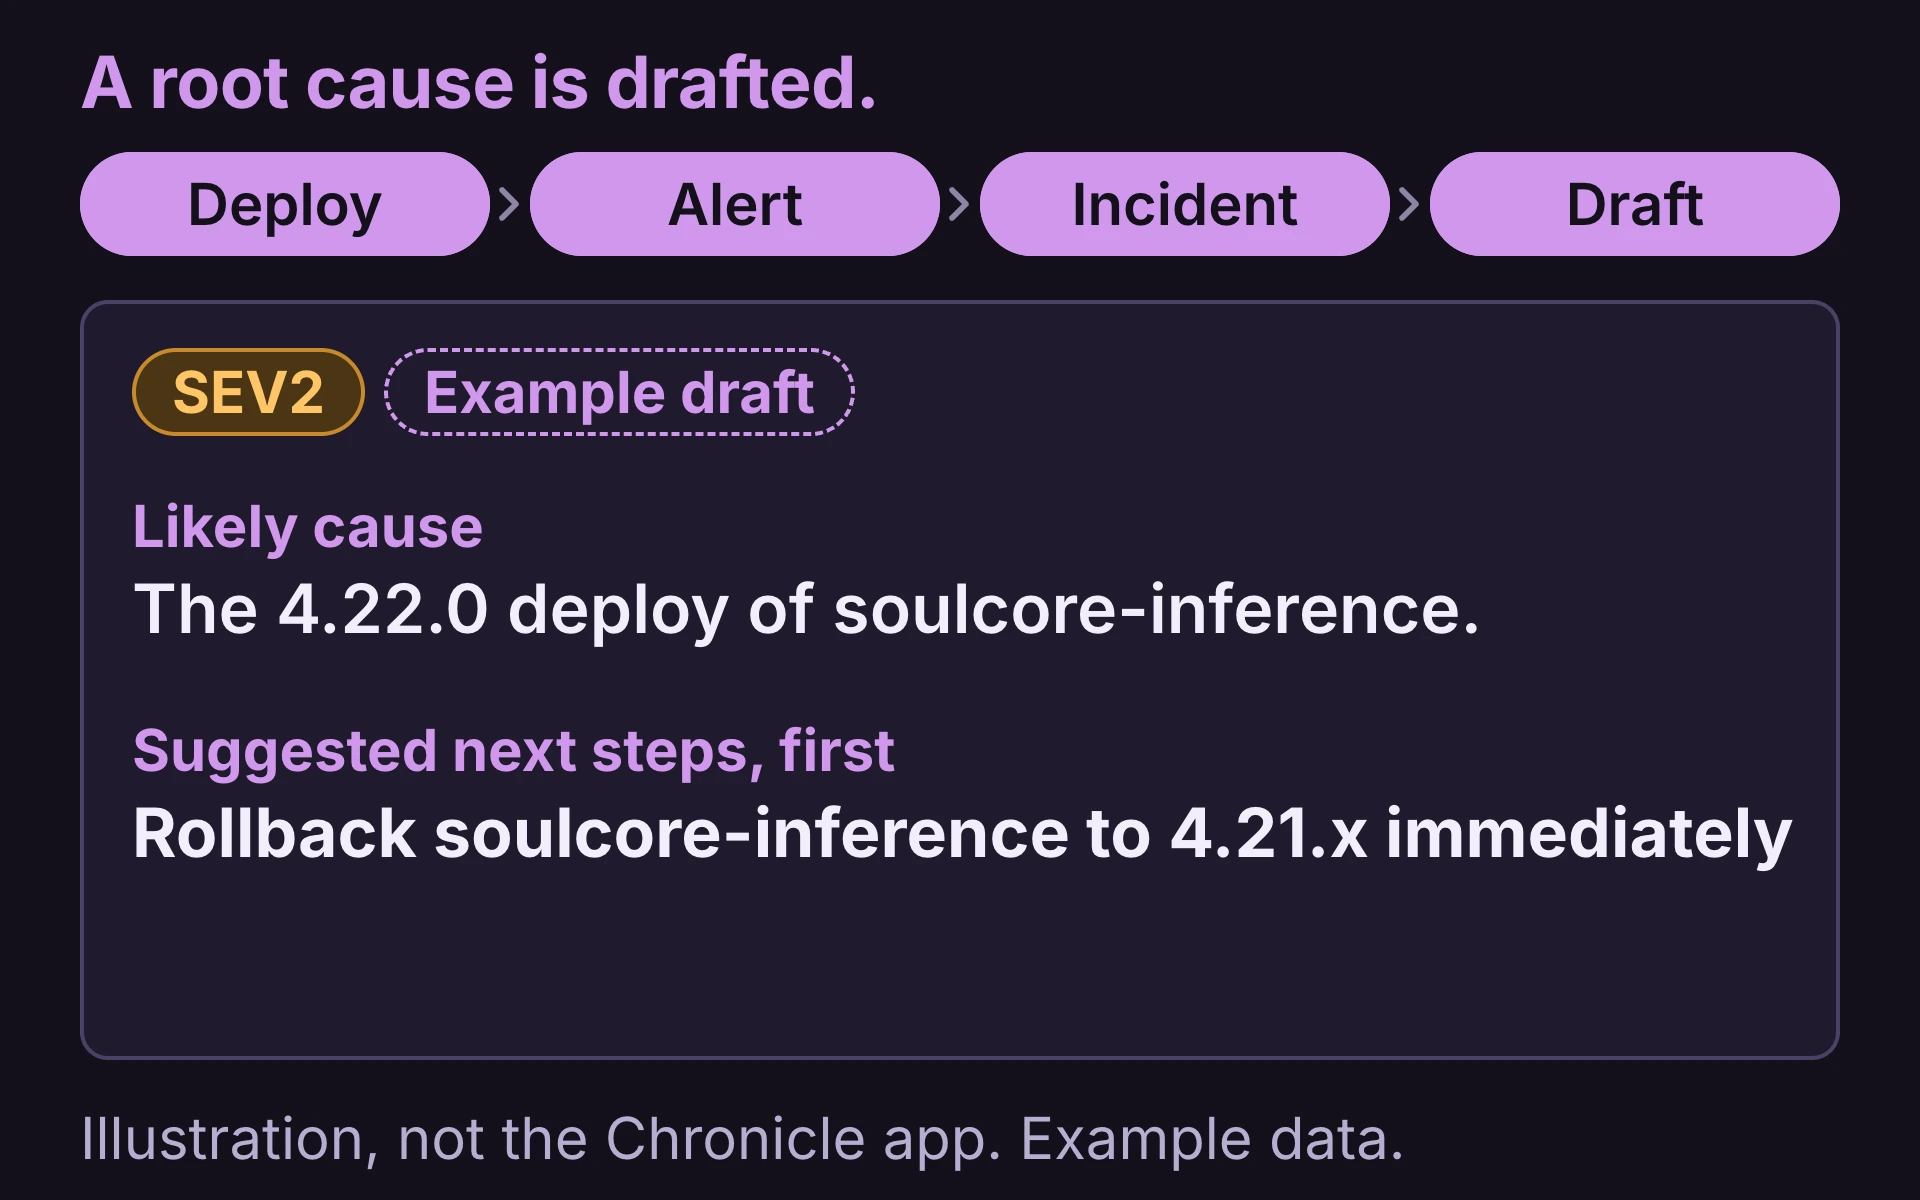
Illustration, not the Chronicle app, with example data. A deploy of soulcore-inference 4.22.0 lands and the p95 latency line climbs through its 200 millisecond threshold, so the rule fires and its alert goes red. A responder or an agent then opens a SEV2 incident; no alert opens one by itself. Chronicle sends the deploys from the last 2 hours and the error logs and error spans from the last 30 minutes to Mercury 3, which drafts a root cause: here the likely cause is the 4.22.0 deploy and the first suggested next step is to roll soulcore-inference back to 4.21.x.
Issues, grouped
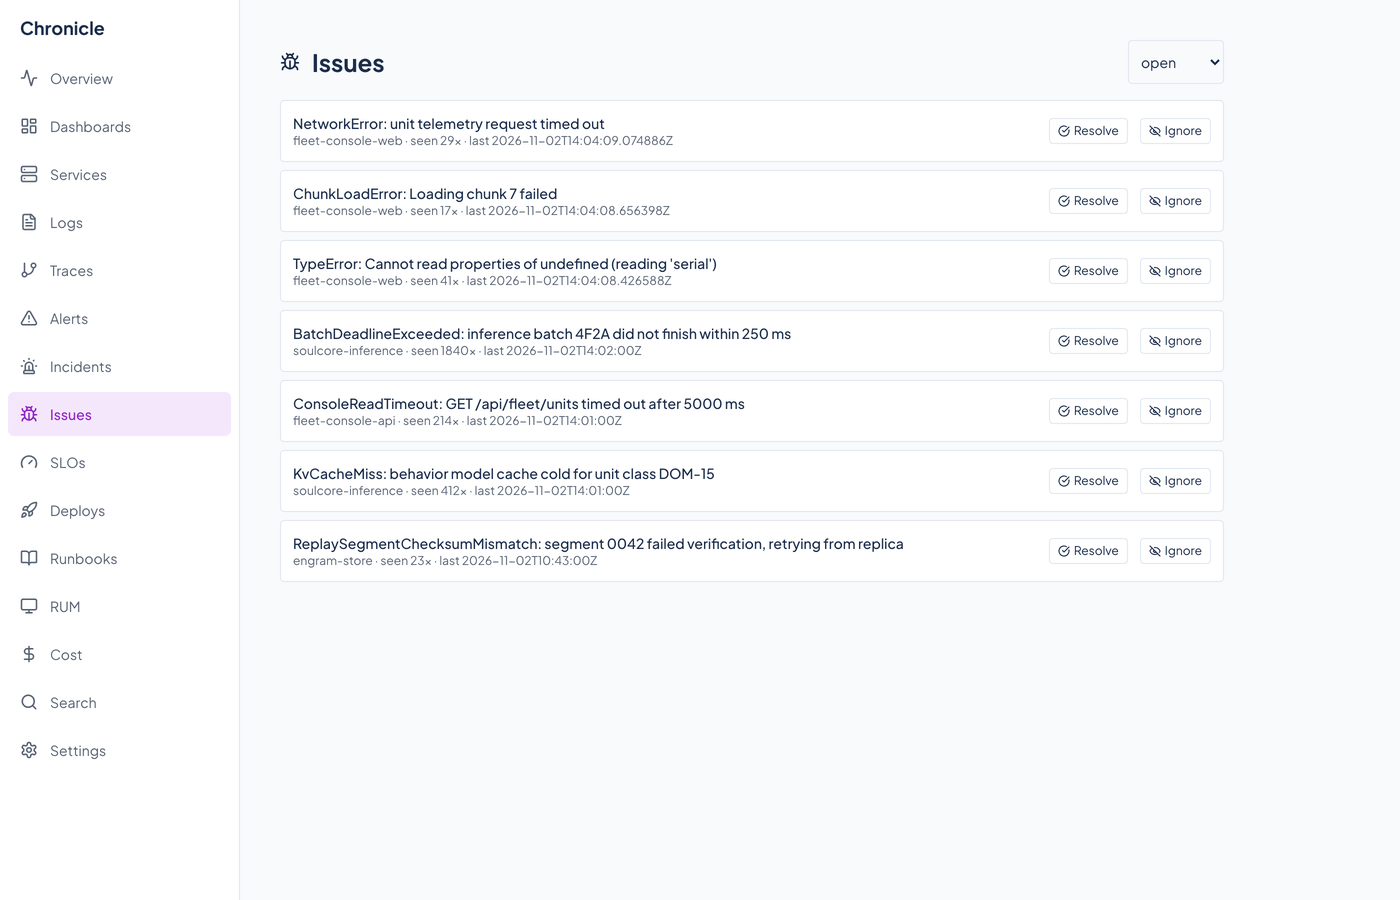
Errors with the same fingerprint collapse into one issue with a count and first and last seen times. A rule or a person can send a noisy one to Docket, though Docket does not accept Chronicle's cards yet.
Runbooks beside the alert
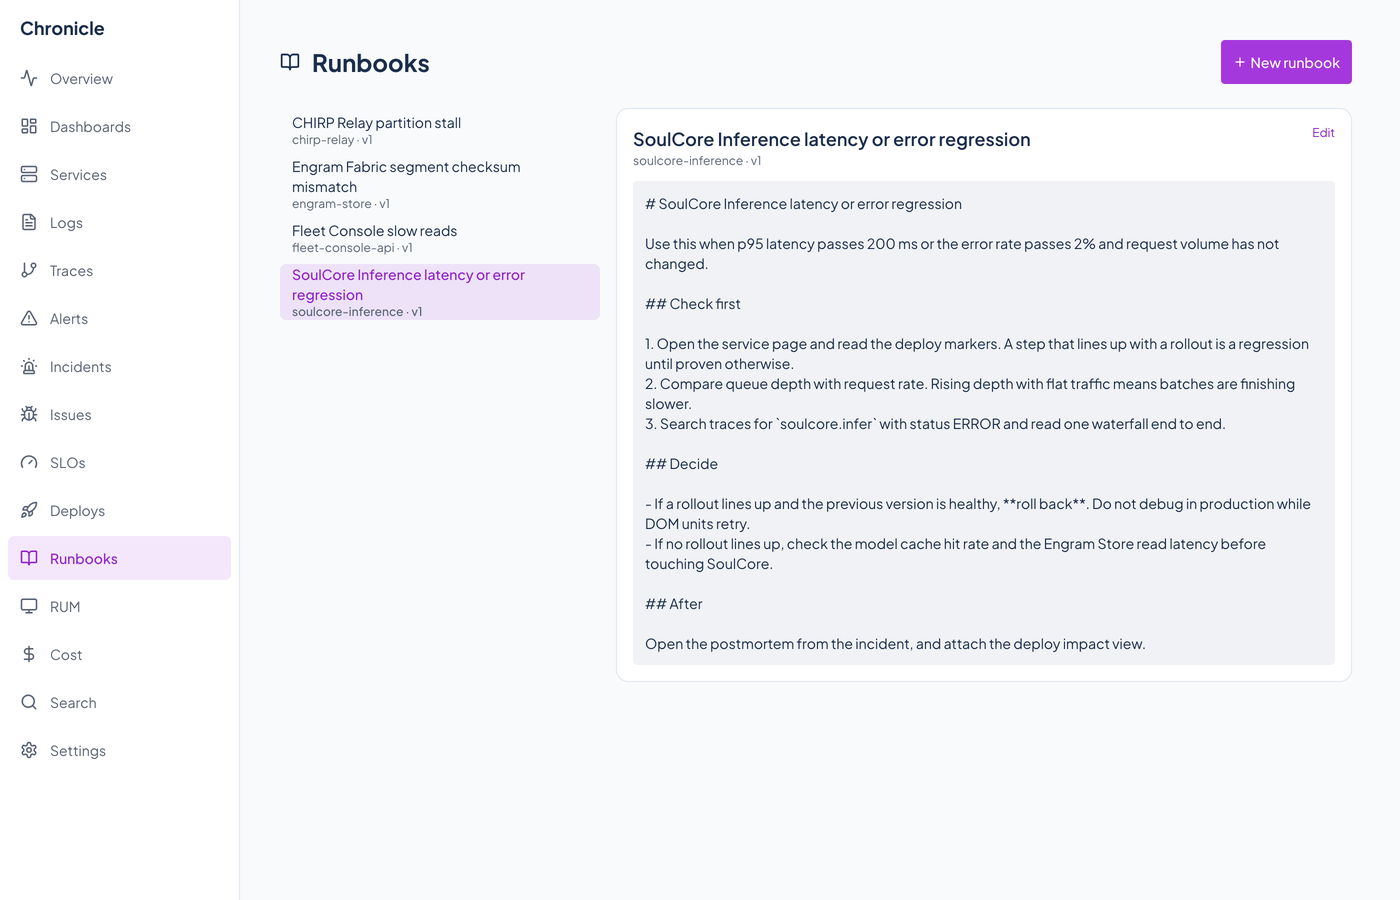
Runbooks are playbooks you write in Chronicle, and an alert rule can carry a runbook address.
Ask, search, attribute, and control
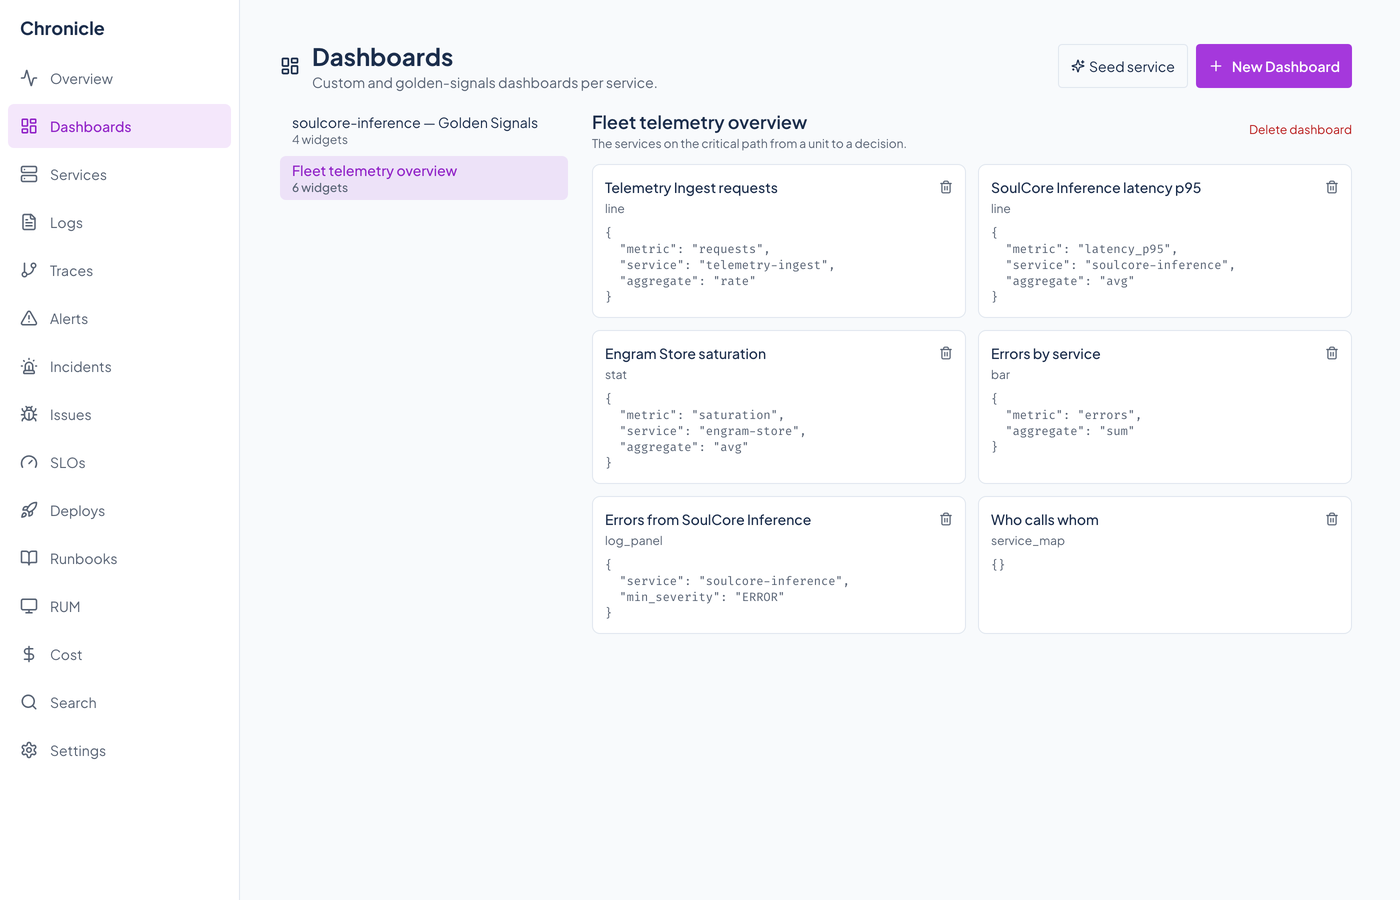
Dashboards from queries
A dashboard is a set of widgets, each a saved metric, log, or trace query. One click seeds the four golden signals (request rate, error rate, p95 latency, saturation) for a service.
- Ask in plain English
- A natural-language box turns a sentence into a metric or log query. If the model cannot be reached, a rule-based translator handles the common phrasings.
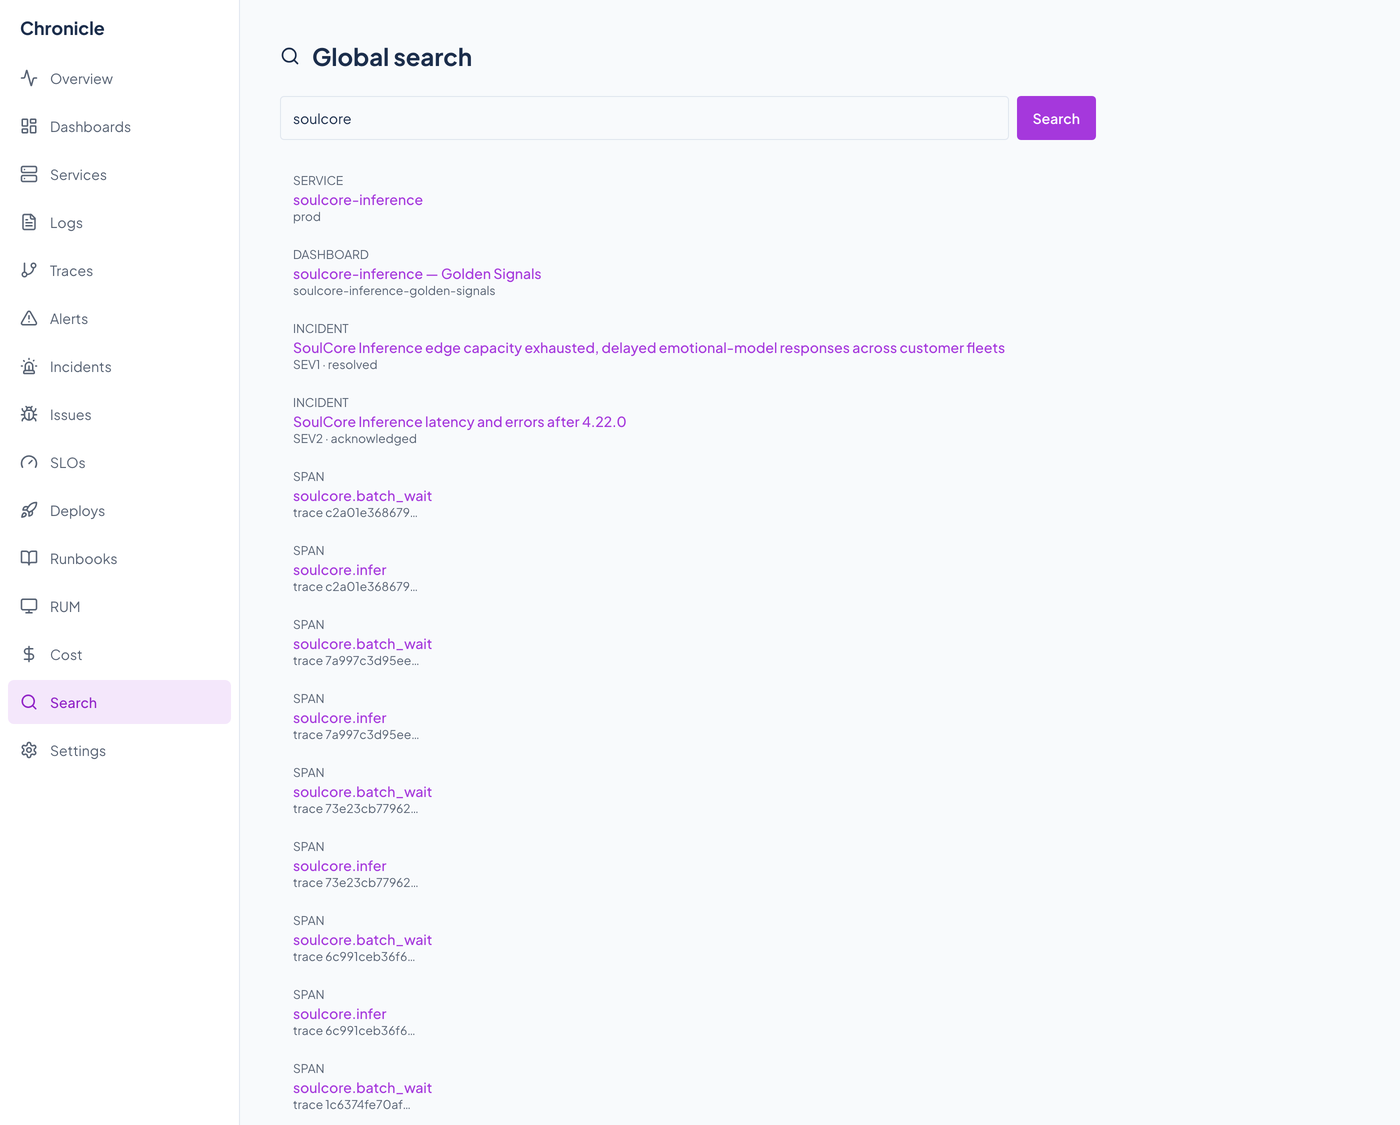
One search box
Search runs across services, dashboards, incidents, issues, log bodies, and trace operations in one request.
- A live event stream
- A WebSocket endpoint streams alert firings and resolutions, incident events, and newly ingested logs to any client that connects with credentials. The web app does not use it yet.
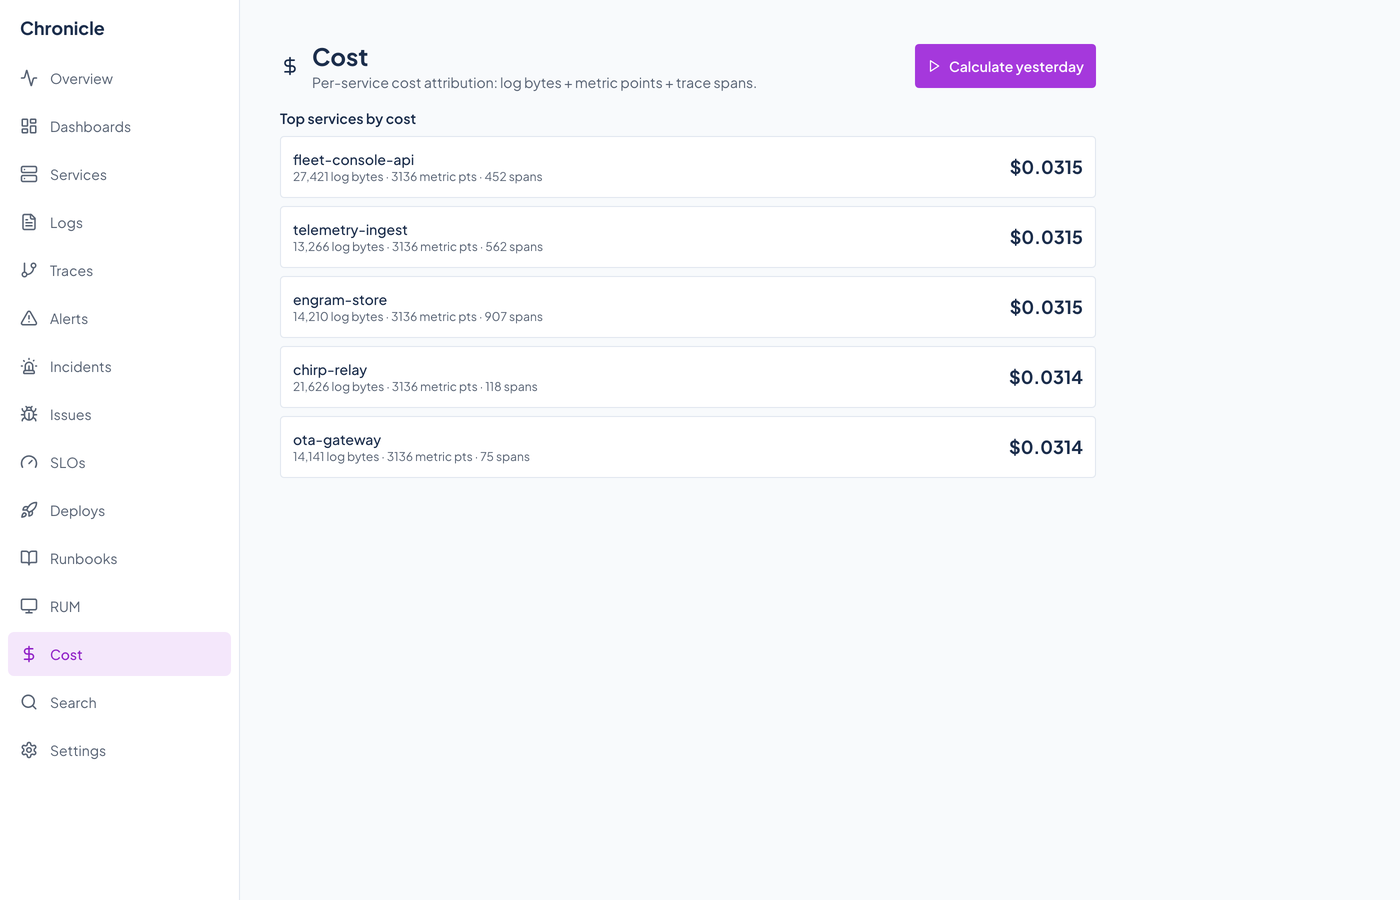
Cost by service
A nightly job attributes storage cost to the service that produced it, from log volume, metric series, and spans, and a cardinality view shows which metrics hold the most points.
- Roles, keys, and an audit trail
- Six roles (viewer, responder, engineer, sre, admin, and a separate billing role), workspace-scoped API keys shown once at creation, and an audit log of write requests.
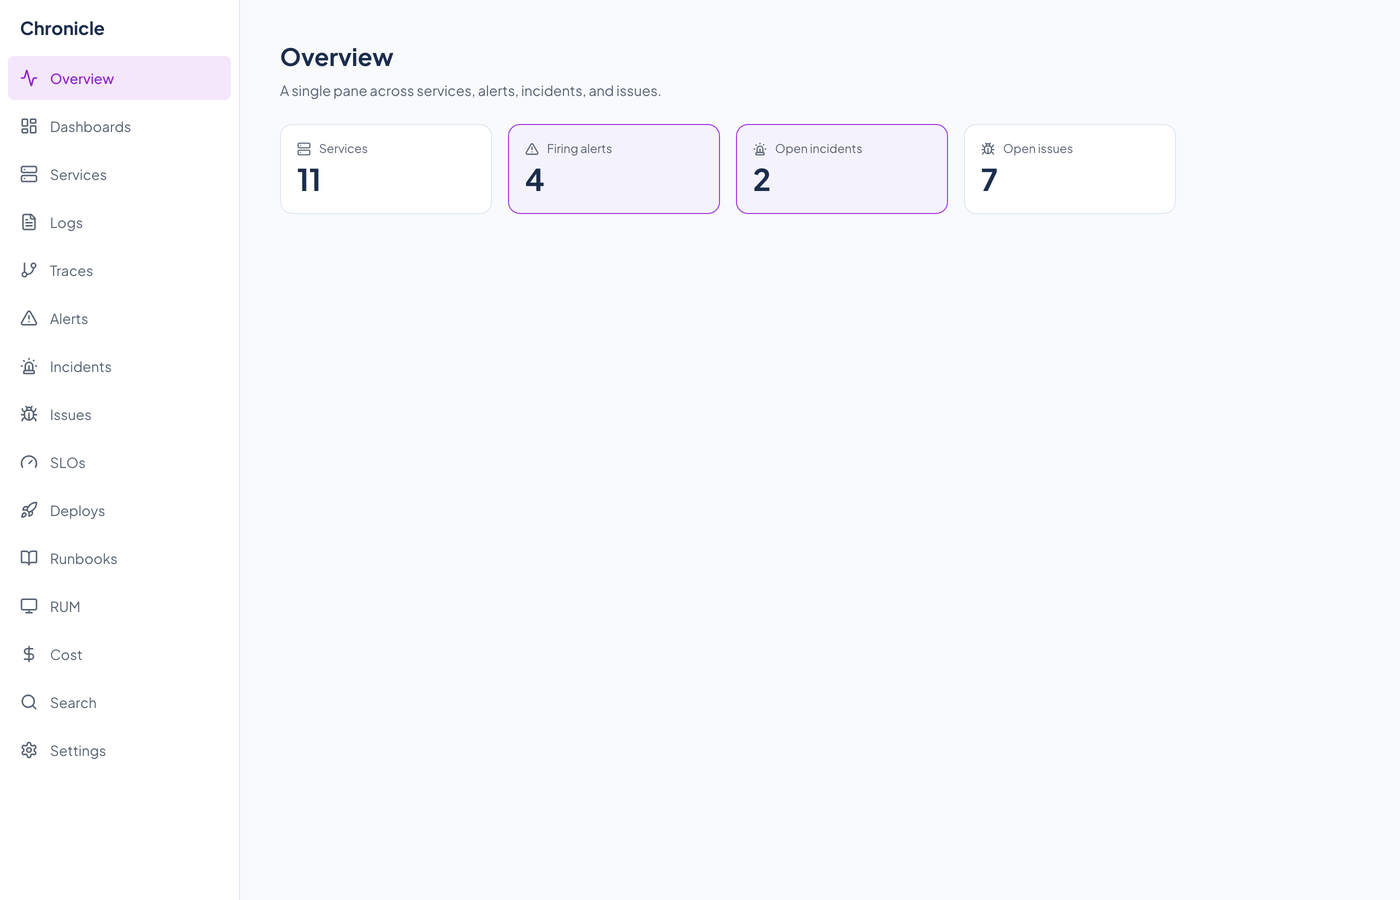
See it in light and dark
Real captures of the running tool, with fictional StrataForge Robotics data. They follow your theme.
From a signal to a resolution
Emit
A service sends OTLP, a Prometheus sample, a StatsD line, a syslog line, or a call through the Python SDK. Metrics, logs, and spans carry the service name, and logs and spans carry the trace id.
Store
Chronicle redacts logs, writes metrics, logs, and spans to ClickHouse, and keeps services, rules, SLOs, and incidents in PostgreSQL. If ClickHouse is away, batches wait in Valkey.
Alert
Workers evaluate alert rules every 10 seconds and SLOs every minute. A firing rule becomes an alert, and a responder or an agent opens an incident when one is needed.
Resolve
A drafted root cause, the incident timeline, the runbook, and a postmortem scaffold are there when the responder is.
Built so everyone can use Chronicle.
Chronicle's web app was scanned with axe-core in a real browser on 10/29/2026, on all 16 captured views in light and dark. The first scan found real problems (low-contrast buttons and text, a missing level-one heading, unnamed chart bars, and a menu pattern the app did not honor); they were fixed the same day, and the rescan reported no violations. Keyboard, motion, and reflow checks were scripted too. Nobody has used it with a screen reader, and we do not claim a WCAG conformance level.
Partly supported
Keyboard operation
The first Tab stop is a skip link that appears on screen, the sidebar is plain links in a labeled navigation landmark, and 24 Tab stops through the Alerts page each showed a visible focus indicator. Enter on a focused link opens its page. Other screens, and the arrow-key and Escape behavior of dialogs, have not been walked with a keyboard alone.
Partly supported
Screen reader landmarks and labels
axe-core found no violations on any captured view after the fixes: names, roles, labels, landmarks, one level-one heading, and named chart bars. The app has not been used with a screen reader, and live updates are not announced.
Supported
Contrast in light and dark
Text, buttons, badges, and the active navigation item clear 4.5:1 in light and dark. The first scan found white text on the dark accent at 3.3:1, accent text on its tint at 4.0 to 4.4, and amber, red, emerald, and destructive text at 3.2 to 4.4; all were fixed with new accent tokens and darker shades.
Supported
Reduced motion
With the reduced-motion setting on, animation and transition durations collapse to about a hundredth of a millisecond, through a rule in the design system's tokens that applies to every element.
Partly supported
Text resize and zoom
The layout reflows without sideways scrolling at 640 and 320 pixels wide on all 14 routes in both themes, which is a 1280-pixel window at 200 and 400 percent zoom. Changing the browser's default font size has not been tested.
Partly supported
Mobile and touch
All 14 routes fit a 375-pixel phone screen with no sideways page scroll in both themes, and the sidebar becomes a slide-in menu opened by a labeled button. Some controls are under 44 pixels: the menu button is 36, the floating bug-report button 48 by 36, and the Acknowledge links on Alerts are 16 pixels tall.
Under the hood
| Backend |
|
|---|---|
| Frontend |
|
| Ingest |
|
| SDK and beacon |
|
| AI |
|
| Agents |
|
| Stands in for | Datadog, New Relic, Grafana, Splunk |
Built for agents as well as people
Agents triage through Chronicle's MCP tools: ask for metrics, logs, and traces, work an alert or an incident, and manage rules, SLOs, and dashboards. Many of them change state, so what an agent can do depends on its role.
Health and services
check_service_healthget_diagnosticsget_my_identitylist_servicesget_service_map
Query
query_metricquery_logstranslate_nl_queryget_tracesearch_tracesget_genai_summary
Deploys
list_deploysrecord_deploy
Alerts
list_alert_rulescreate_alert_ruleupdate_alert_ruledelete_alert_rulelist_firing_alertsack_alertevaluate_alertscreate_silencelist_silences
Incidents
open_incidentlist_incidentsget_incidentacknowledge_incidentmitigate_incidentresolve_incidentadd_incident_noteset_incident_commanderdraft_rcarun_postmortem
Issues
list_issuesresolve_issueignore_issuefile_issue_to_docket
SLOs
list_sloscreate_sloevaluate_sloget_slo_historydelete_slo
Dashboards
list_dashboardsget_dashboardcreate_dashboarddelete_dashboardadd_widgetupdate_widgetdelete_widgetseed_golden_signals_dashboard
Cost and RUM
calculate_costget_top_cost_servicespost_cost_to_trellisget_rum_vitalsget_rum_top_error_pagesget_rum_session
Questions people ask
Is Chronicle available to other teams?
Chronicle is the observability platform Renkara's own fleet runs on, and this site describes what it does today. There is no sign-up, price, or trial here. Write to fleet@renkara.com with questions.
Does it replace Datadog, Grafana, or Splunk?
It covers the same ground for the things listed on this page: metrics, logs, traces, alerts, SLOs, and incidents, with OpenTelemetry in. It is a young system, so check this page against what you need.
Can I send it data from any OpenTelemetry SDK?
From any exporter that can send OTLP over HTTP with the JSON encoding.
Does the AI see my data?
Yes, in a narrow way. To draft a root cause, Chronicle sends the incident title, service, and severity, plus recent deploy, error log, and error span lines, to Mercury 3, which Inception Labs runs. Natural-language queries and AI-built dashboards send the sentence you typed. Nothing else in Chronicle calls a model provider.
What happens to personal data in logs?
Chronicle replaces card-shaped numbers, Social Security numbers, JSON Web Tokens, and email addresses in log lines with a marker before storing them. It is a pattern match, so it does not catch everything. Treat it as a safety net, not a guarantee.
How long is data kept?
As written in the schema today: 14 days of metric points, 7 days of logs, and 3 days of spans.
Is the data in the screenshots real?
No. Every screenshot is a capture of the running app against fictional StrataForge Robotics data, a made-up company.
Questions about this tool?
Write to Renkara Media Group and a person will answer.