
From a signal to a resolution.
Chronicle is a FastAPI service with workers behind it. Services send it telemetry, it stores that in ClickHouse and PostgreSQL, workers evaluate alert rules and SLOs on a clock, and people and agents work incidents against what it holds.

Getting telemetry in
Five ways in today. All of them end up in the same stores, and every metric, log, and span carries the name of the service that sent it.
| OTLP over HTTP | OpenTelemetry's JSON encoding, posted to /api/v1/otlp/v1/metrics, /logs, and /traces. |
|---|---|
| The Python SDK | init_chronicle(service_name) sets up OpenTelemetry to export spans and metrics to Chronicle, and a log handler ships logs. It is import-safe: if Chronicle is unreachable the service keeps running, and failures log as warnings that are throttled to one a minute. |
| Prometheus remote write | POST to /api/v1/prom/write with the workspace in an X-Chronicle-Workspace header. The snappy-compressed protobuf Prometheus sends is decoded, and a JSON form is accepted too. |
| StatsD and syslog | A UDP listener for StatsD and DogStatsD lines and a UDP and TCP listener for syslog (RFC 3164 and 5424). Each starts only when its port is set. |
| Browser beacon | A script tag sends Web Vitals, JavaScript errors, page views, and route changes to a public, rate-limited endpoint, batched every 5 seconds and on page hide. |
from chronicle_sdk import init_chronicle

init_chronicle("telemetry-ingest")  # endpoint, token, and workspace come from
# CHRONICLE_URL, CHRONICLE_TOKEN, CHRONICLE_WORKSPACE_IDWhat Chronicle does to a log line
Redact
Card-shaped numbers, Social Security numbers, JSON Web Tokens, and email addresses in the body are replaced with a marker. The original is not kept.
Attach
The line keeps its severity, attributes, trace id, span id, and an interestingness score (0.5 unless the sender sets one) and a pattern id if the sender provides it.
Write
Metric points, log events, and spans go to ClickHouse. If it is unavailable, the batch waits in Valkey (64 MiB by default) and is written when it returns.
Notify
An in-process event announces the new data, which the WebSocket stream relays to connected clients.
Delivery is at least once. A batch ClickHouse stored but did not acknowledge can arrive twice, and a Valkey restart without persistence loses a waiting batch.
Where it all lives
| ClickHouse | Metric points, log events, and spans, in time-partitioned tables with a time-to-live: 14 days for metric points, 7 for logs, 3 for spans, as written in the schema. |
|---|---|
| PostgreSQL | Everything relational and small: workspaces, services, alert rules and firing alerts, silences, incidents and their notes, SLOs and their evaluations, dashboards, issues, deploys, runbooks, cost buckets, API keys, and the audit log. |
| Valkey | The Celery broker, the ingest spool, and the cache. |
| Retention | Data older than its time-to-live is dropped by ClickHouse. |
A clock behind the screens
Celery workers and a beat scheduler do the periodic work. If the scheduler is not running, SLO numbers go stale.
| Job | How often | What it does |
|---|---|---|
| Alert evaluation | Every 10 seconds | Evaluates each rule's metric over its window and fires or resolves alerts. |
| SLO evaluation | Every minute | Recomputes attainment, error budget remaining, and burn rate; runs the budget policy on a change. |
| Anomaly detection | Every minute | Compares each metric with a baseline of its recent mean and standard deviation and flags large departures. |
| Incident write-ups | Every minute | Drafts a root-cause write-up for open incidents that lack one, up to ten per pass. |
| Cost | Daily at 02:00 UTC | Attributes storage cost to each service from log bytes, metric series, and spans. |
| Fleet syncs | Every 5 minutes to daily | Asks Cadence for on-call data and sends Fulcrum each incident's time to resolve. Neither tool takes these calls yet, so each sync logs a warning and Chronicle carries on. |
From an alert to an incident
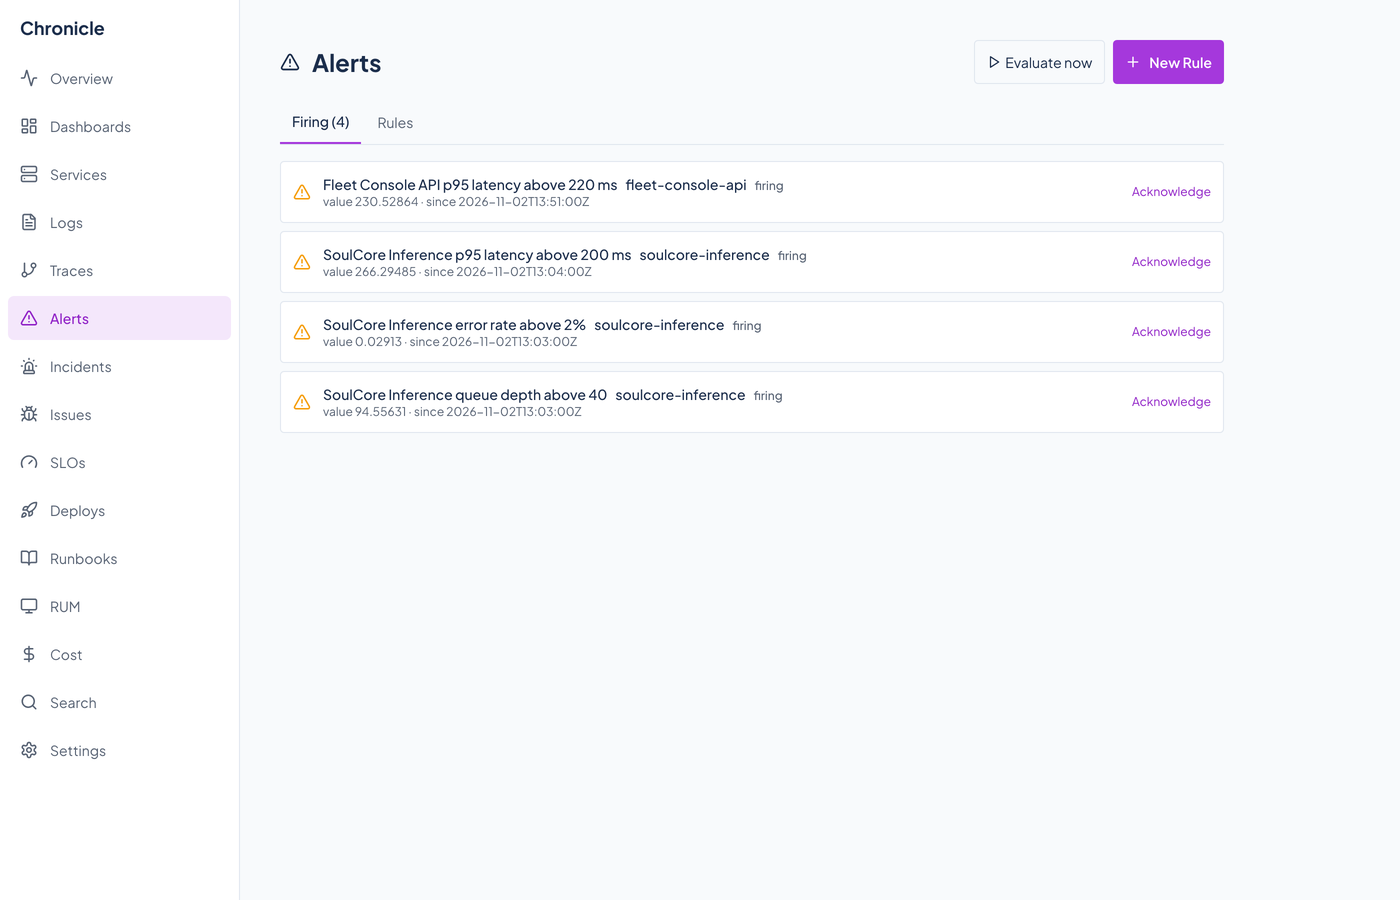
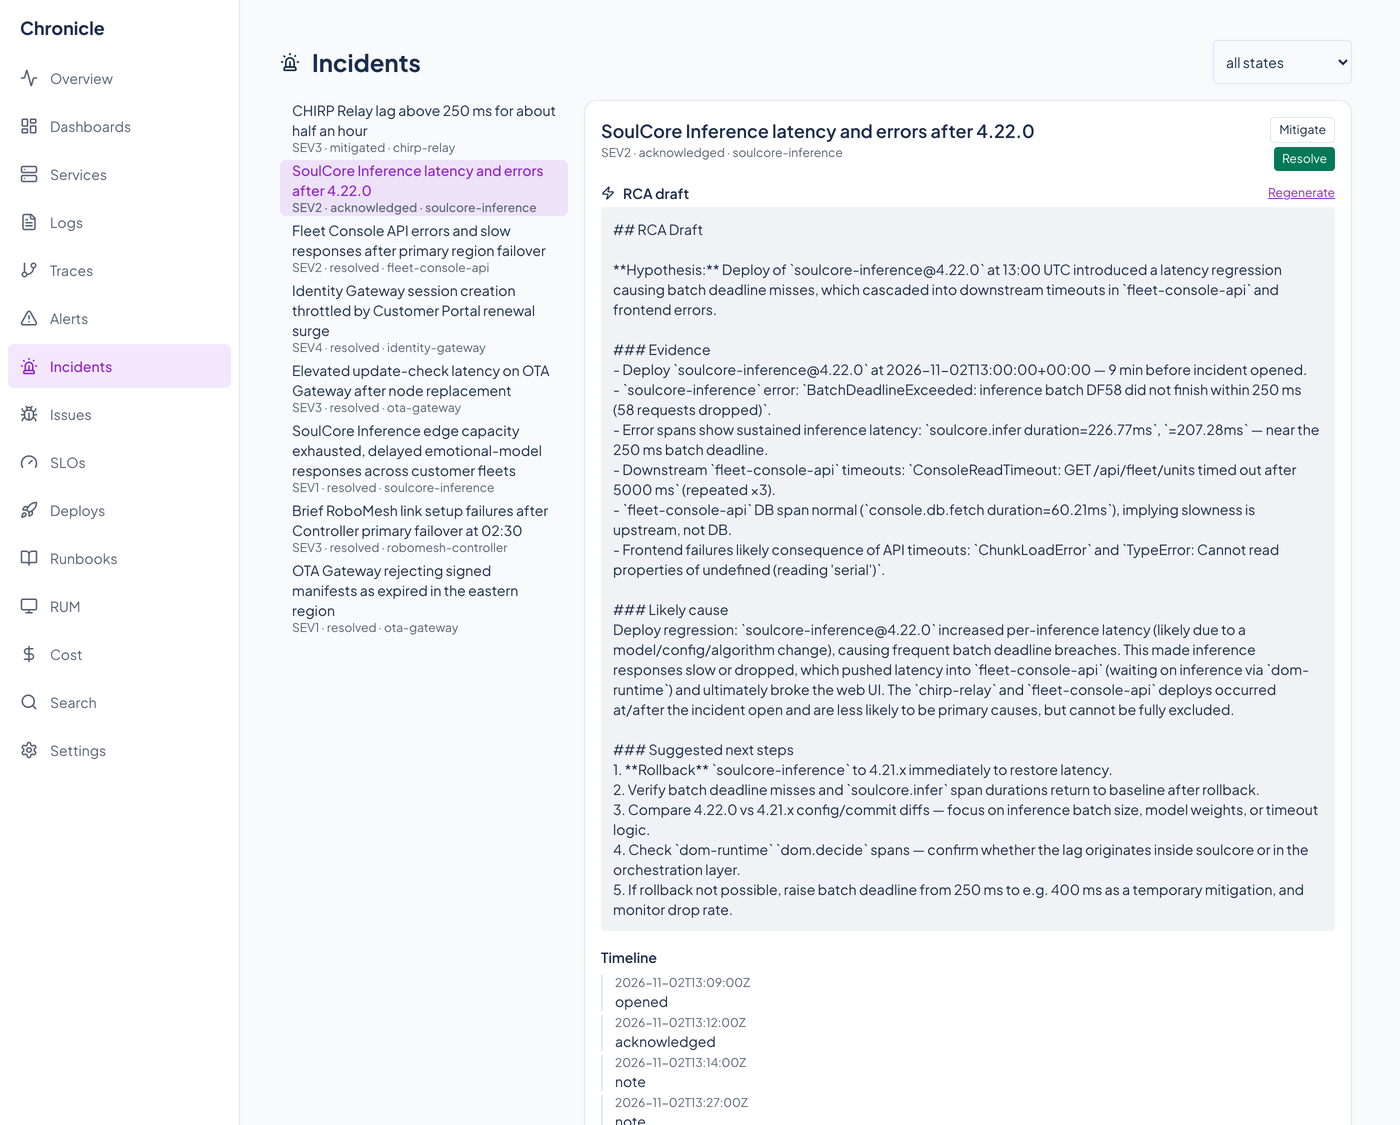
An alert fires when a rule's metric stays over its threshold for as long as the rule says. Chronicle does not turn an alert into an incident on its own; a person or an agent opens one through the API or the open_incident tool. Incidents run from open to acknowledged to mitigated to resolved, with each change timestamped.
Page
Firing and resolved alerts post to Chirp's #alerts channel: scheduled checks through the alert evaluator's relay, and checks you run yourself through Chronicle's own webhook. The on-call lookups in Cadence, Tribe, and Codex reach no working route yet, so no one is paged by name.
Draft
Chronicle gathers deploys from the last 2 hours and error logs and error spans from the last 30 minutes and has Mercury 3 write a root-cause draft in Markdown. With no model available, the draft lists the same evidence and says it is a plain draft.
Work it
Responders add notes, set an incident commander, and move the incident through its states. Agents can do the same through MCP tools.
Close out
A postmortem step builds the timeline and drafts the root cause in Chronicle. It also tries Slate for action items, Narrative for a draft post, Courier for a customer email draft, Meridian for the responder's time, and Fulcrum for the time to resolve; none of those tools takes these hand-offs yet, so each step logs a warning and the rest still run.
SLOs and error budgets
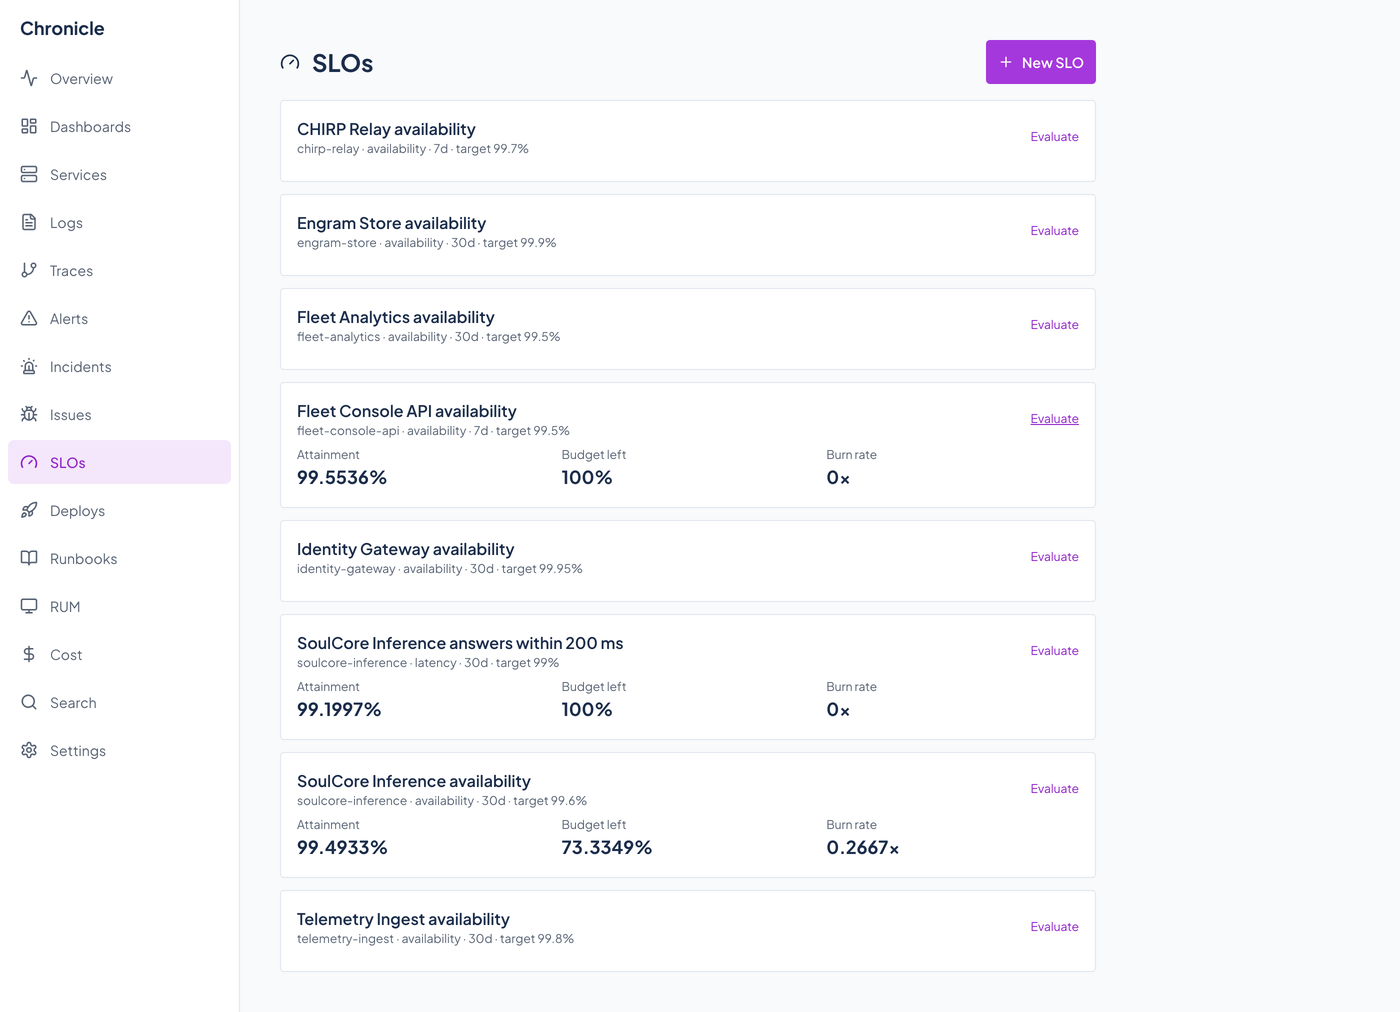
An SLO names a metric (and optionally a separate metric for good events), an objective such as 99.9 percent, and a window of 1, 7, 30, or 90 days. Chronicle sums good and total events over the window, reports attainment, the error budget left, and a burn rate (how many times faster than sustainable the budget is being used). A budget policy can open a Docket card or send a notification when the budget runs out, once, on the change; Docket does not accept Chronicle's cards yet.
What is sent where
Chronicle's own stores stay where they run. Two kinds of outbound calls exist.
| To | What it receives | When |
|---|---|---|
| Mercury 3 (Inception Labs) | For a root-cause draft: the incident's title, service, and severity, plus recent deploy, error log, and error span lines. For an anomaly or deploy narration, a natural-language query, or an AI-built dashboard: the text or numbers involved. | Only when FLEET_MOCK is false and an Inception Labs key is set. Each call has a plain fallback. |
| Fleet tools | Chirp's #alerts channel gets firing and resolved alerts, and Docket is read for a linked card. Chronicle also calls Docket to create cards, Cadence, Codex, Tribe, the notification service, Trellis, Pulse, and the postmortem's Slate, Narrative, Courier, Meridian, and Fulcrum steps, but those calls reach routes or fields the tools do not have yet, so each logs a warning and Chronicle carries on. | Only when the fleet stand-ins are off (FLEET_MOCK is false). Locally Chronicle runs against built-in stand-ins and calls none of them. |
Only the lines gathered for a drafted write-up and what a user types are sent to a model.
Questions about this tool?
Write to Renkara Media Group and a person will answer.